https://www.brookstr...ell-signal-bar/
.
.
.
Edited by tradesurfer, 26 September 2020 - 10:42 AM.

Member
Posted 26 September 2020 - 10:41 AM
Edited by tradesurfer, 26 September 2020 - 10:42 AM.
Member

Posted 26 September 2020 - 02:15 PM
It is important to note that the Emini fell 10% from the high this week. I have talked about the implications of a 10% correction several times before. A 10% selloff means the market is in a correction and not just a pullback. It usually leads to a bigger correction, and the average is about 20%. A 20% selloff is a bear market. The 20% average is skewed by big drops like the 89% Crash in 1929 and the 70% drop during the 2009 financial crisis. However, the point remains that a 10% correction is usually not the end of a move down.
I found this useful.
Member

Posted 27 September 2020 - 12:15 PM
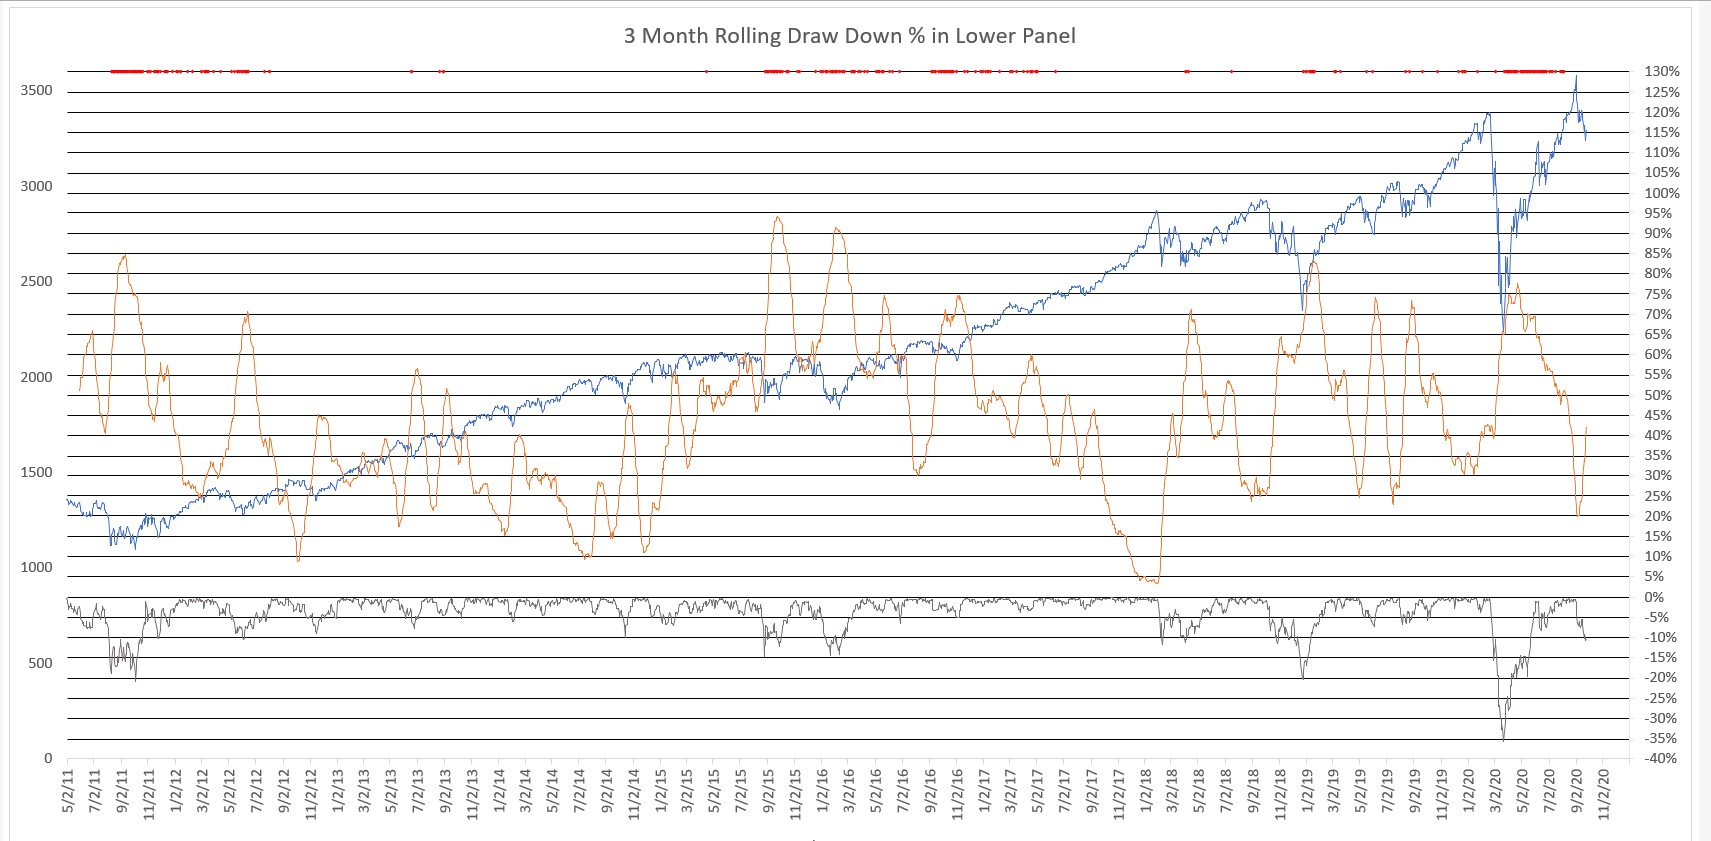
The 3 month rolling correction chart is decent to watch on the SPX. During this correction the NDX hit minus 14%, and the RUT 11% which was about the same as the minus 10% for SPX. Institutional buy the dip has not been seen yet tho.