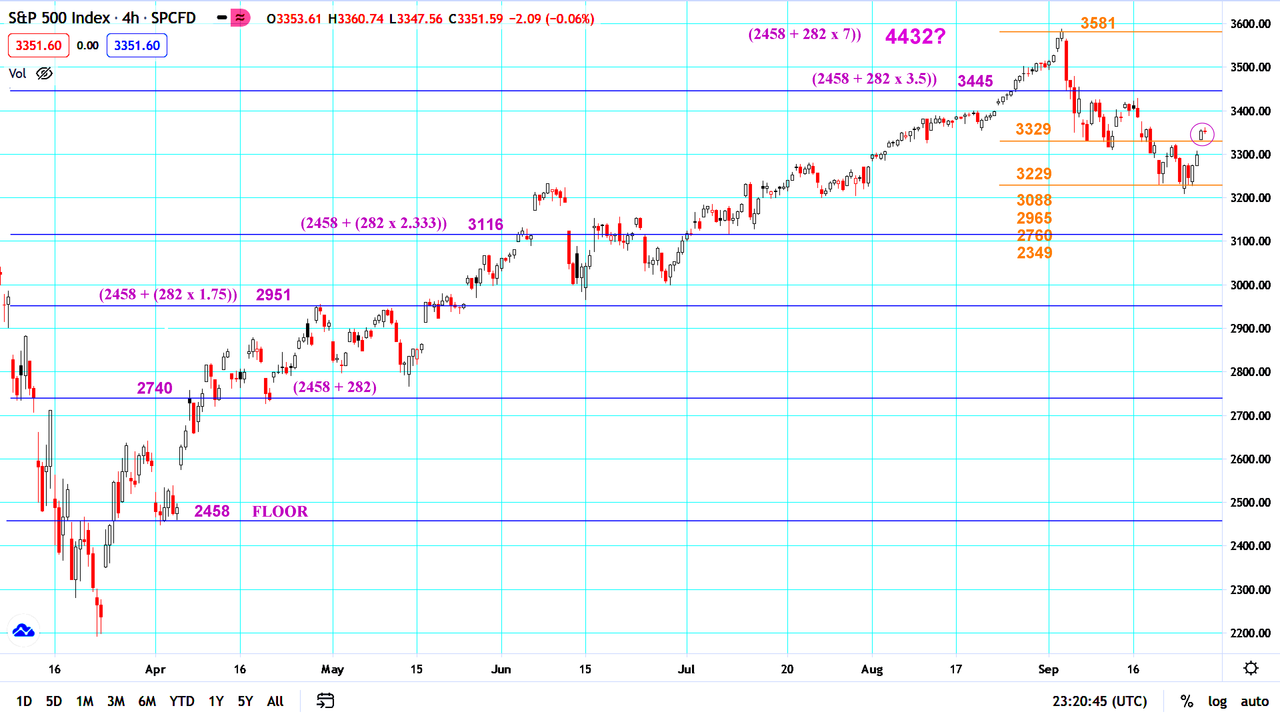
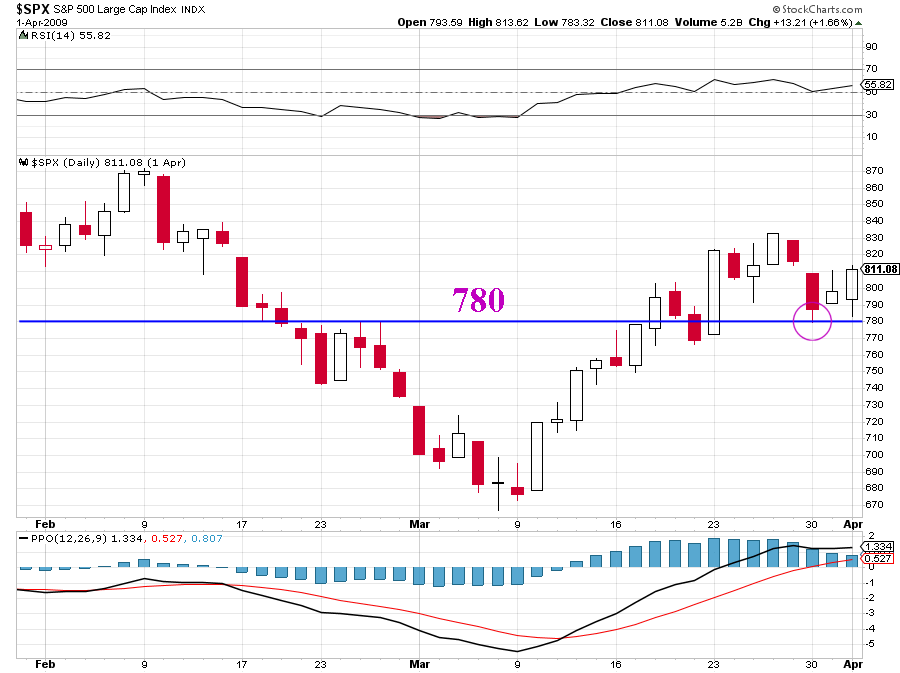
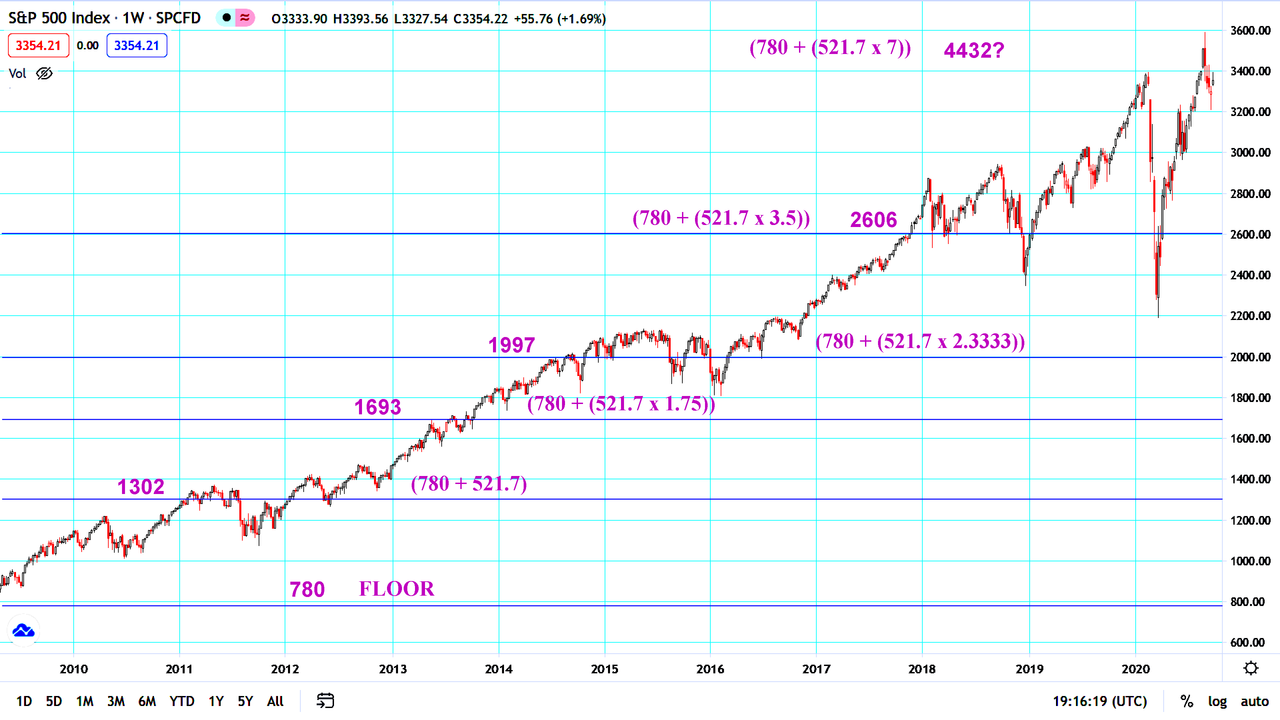
Looked further into the possible incomplete count off the March low that tops out at 4432. This is a clean count with no retraces. Projected 4432 back to 2009. Chose 780 for the floor on March 30th, 2 days after swine flu appeared in the US - seems appropriate enough. The resulting price levels are an interesting fit to the chart and produce no retraces. Maybe 4432 is a significant level.
There seems to be some discrepancy in time frames. Based on when the 3.5 level was reached, the 2020 chart suggests 4432 will be reached at around the end of the year, which is hard to imagine. The long chart is pointing to sometime around the end of 2022. Should the charts not predict the peak to occur at around the same date, independent of time frame? Maybe timing is the key to identifying the true count. To be continued...