Nice charts. I particularly like the Rut chart. Im not bearish here at all. I see more chop likely before heading much higher. I do see a potential short trade developing which would take the rut back into the recent consolidation or slightly above. I should have traded the up and down of the last move on the spx and djia. It was a pretty obvious trade but I have been way too busy at work to play the in and out. We may only retrace half of the recent up. I am more interested in individual stocks at this point. Much greater potential for percentage moves. This market reminds a lot of the tech bubble. So many stocks made huge moves in a very short amount of time. Most of what I am watching suggest we may not go much higher just yet. As you know this could change on any given day.

SPX short term top possible (eom
Started by
slupert
, Nov 17 2020 07:14 AM
15 replies to this topic
#12

sixpack
-

- Traders-Talk User
- 62 posts
Member
Posted 20 November 2020 - 12:11 AM
Upon further study I am leaning more towards your analysis. Looks like the consolidation has pretty much finished and the last down provided a nice platform for the present spring higher which could run a little here. Crazy TSLA. Told our 401k guy who has some big money folks he should buy that thing when it was around 400 last week. The chart was screaming new highs coming. That was quick. Just like the big tech run years ago.
#13
tsharp
-

- Traders-Talk User
- 1,487 posts
Member
Posted 20 November 2020 - 05:35 PM
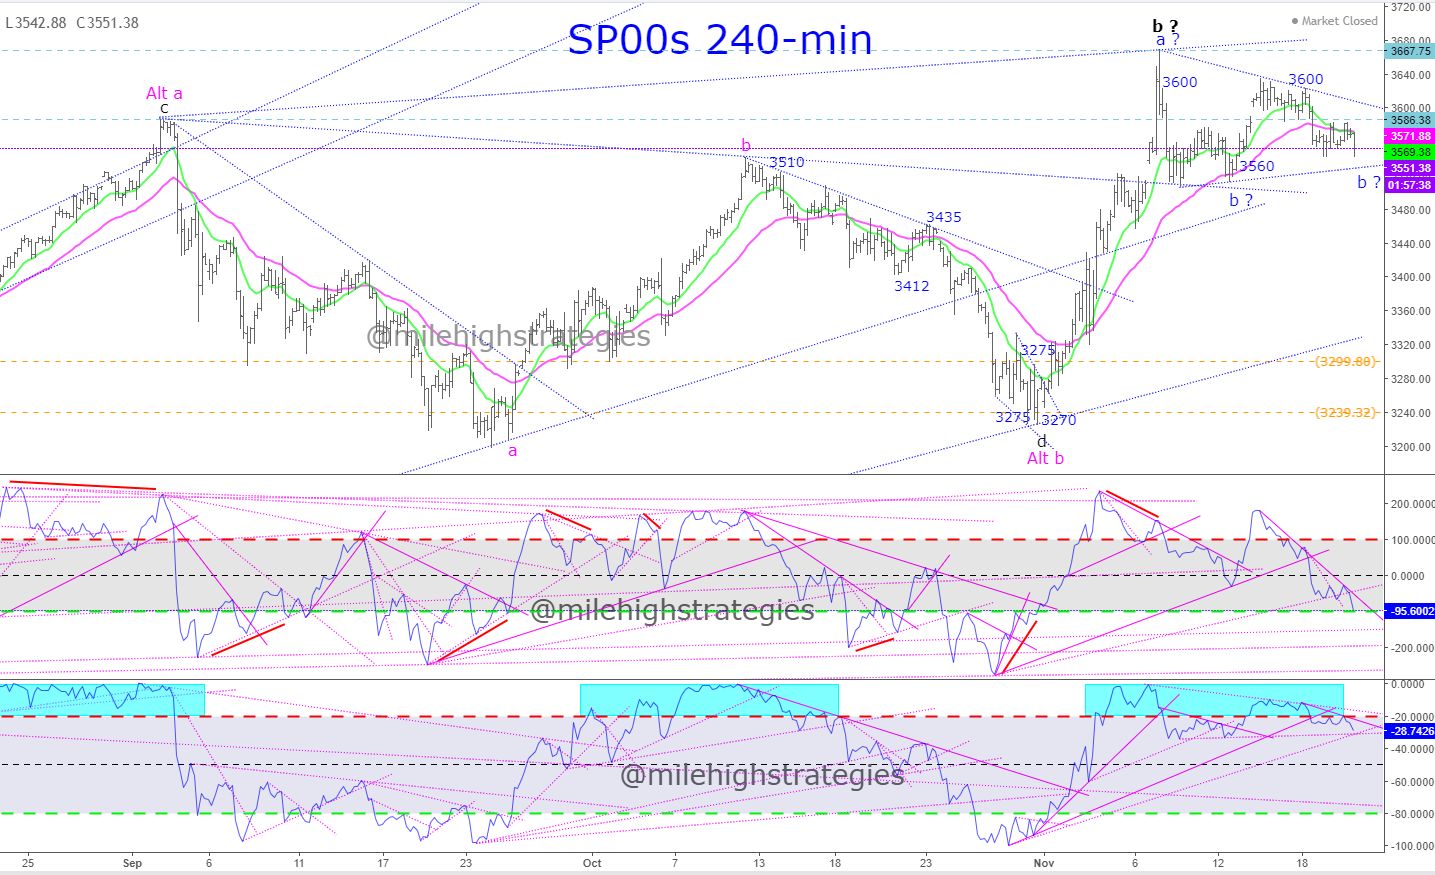
My main swing signal tried twice today to reverse back upward, though could not... still short from 3600, though there are many reasons why it could reverse back upward as soon as Monday:
#14
tsharp
-
- Traders-Talk User
- 1,487 posts
Member
Posted 21 November 2020 - 10:12 AM
SPX DAILY HURST PROJECTIONS & CYCLES UPDATE
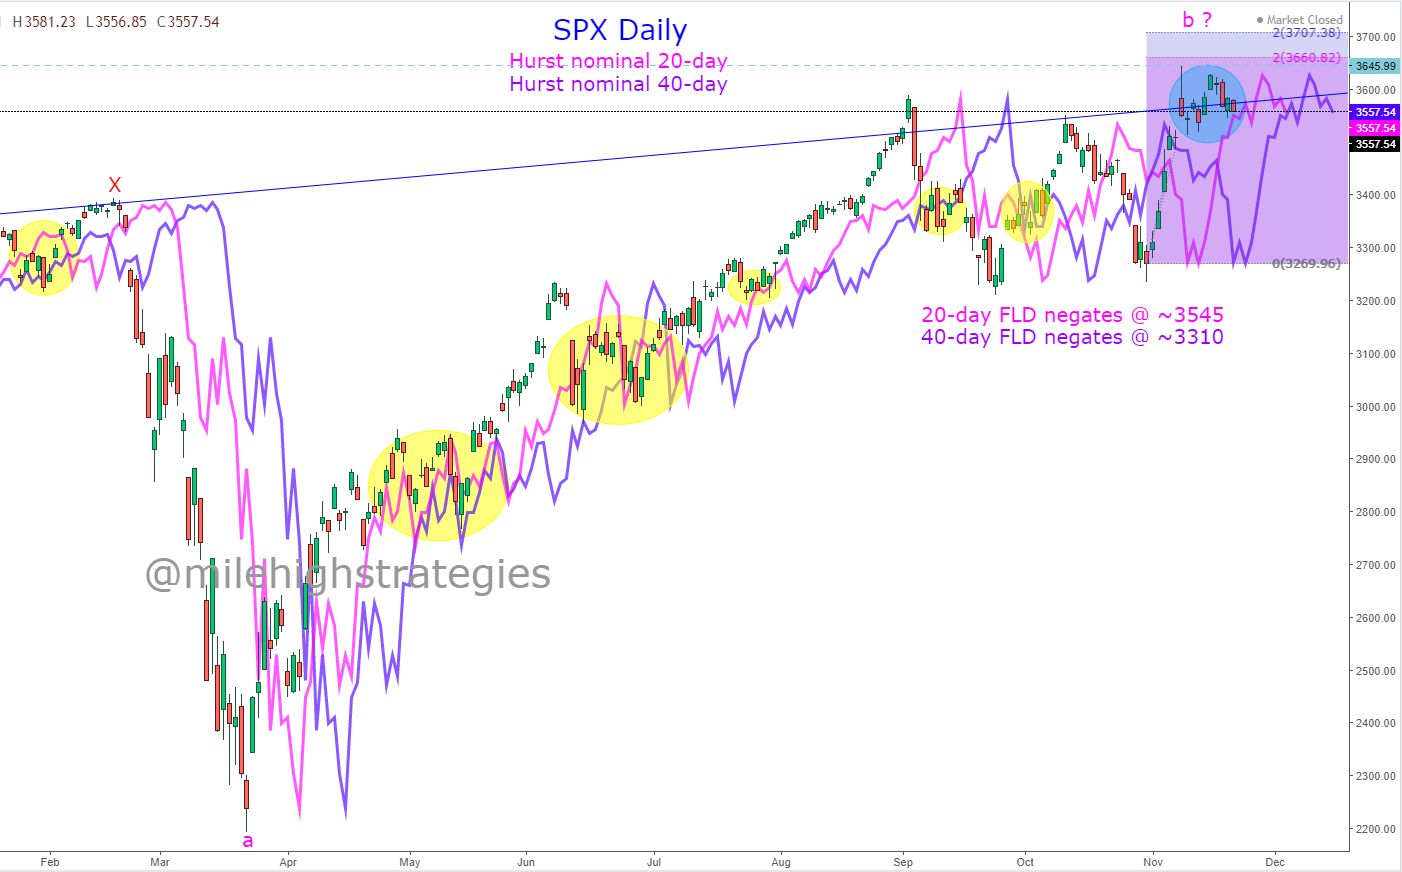
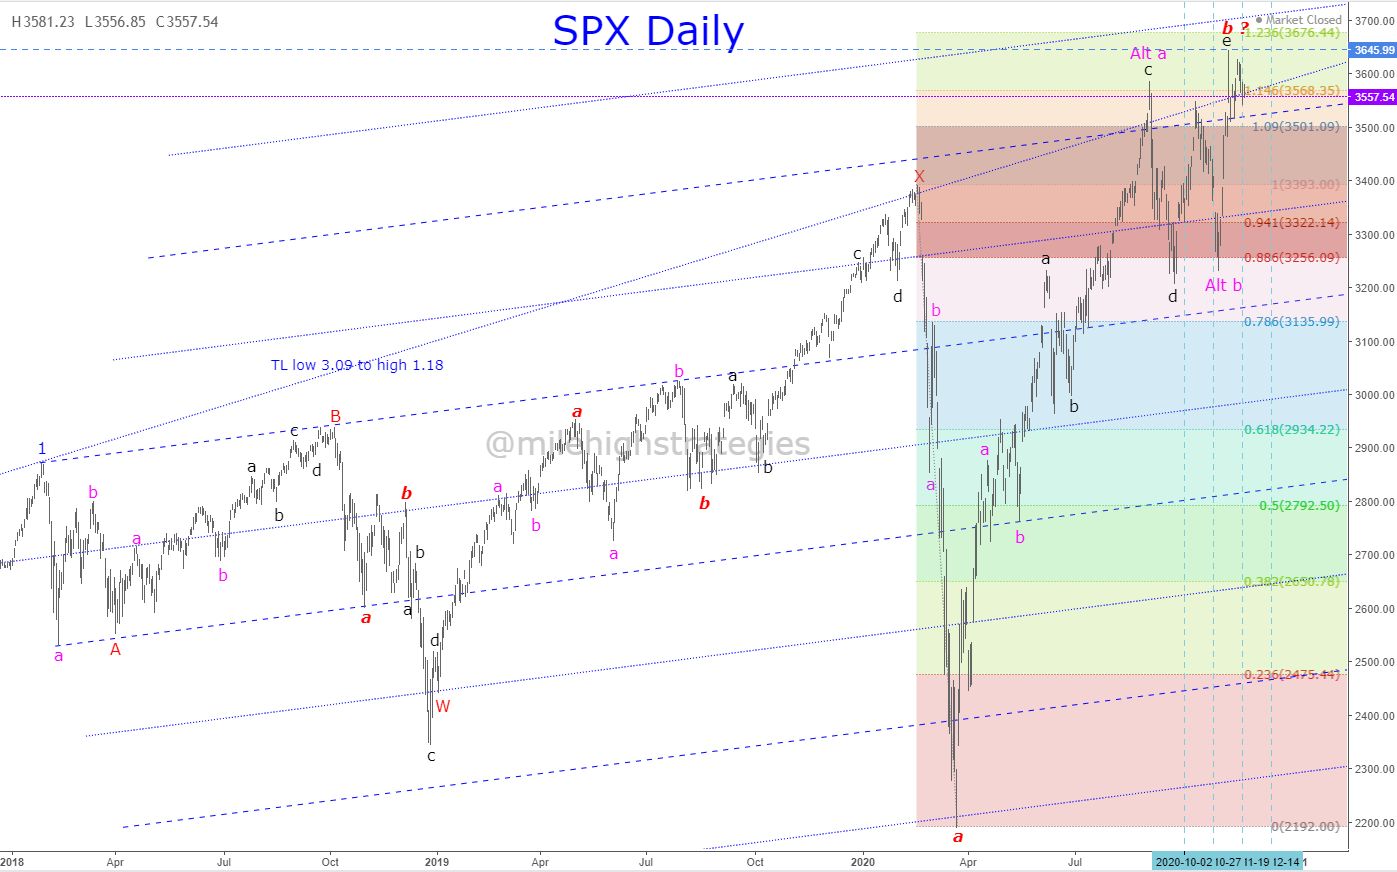
The first chart is the SPX daily chart with the nominal 20-day and 40-day FLDs, showing that the high of 3645.99 was not enough to fulfill either of the two projections still above at ~3661 and ~3707, respectively, and the closing prices for Monday where these would negate are on the chart, and note also the cyan highlight showing the dance above and below that important UTL from the 3.2009 low to the 1.2018 high - will it hold the rally or will the rally finally leave it behind?
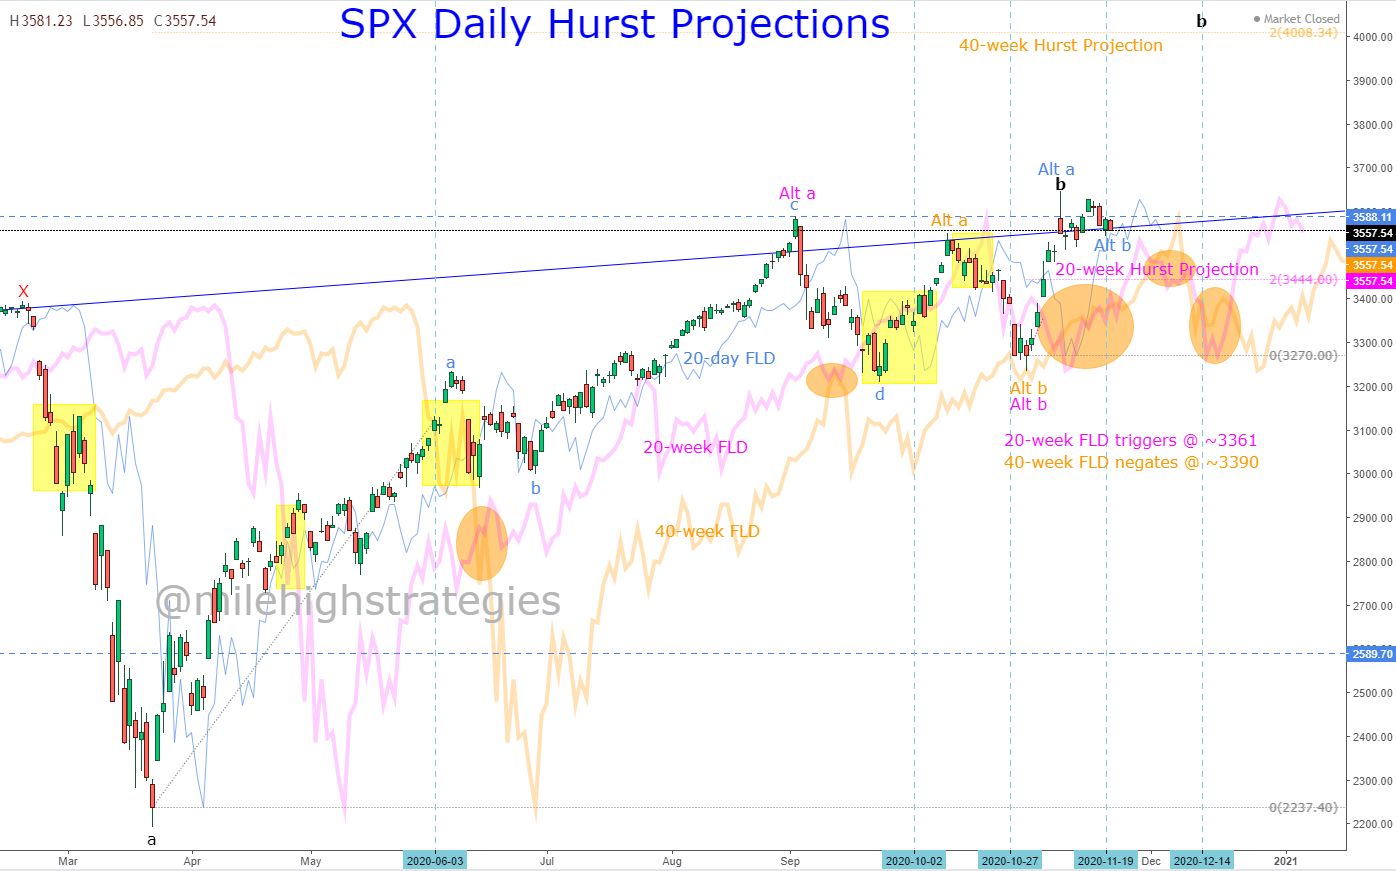
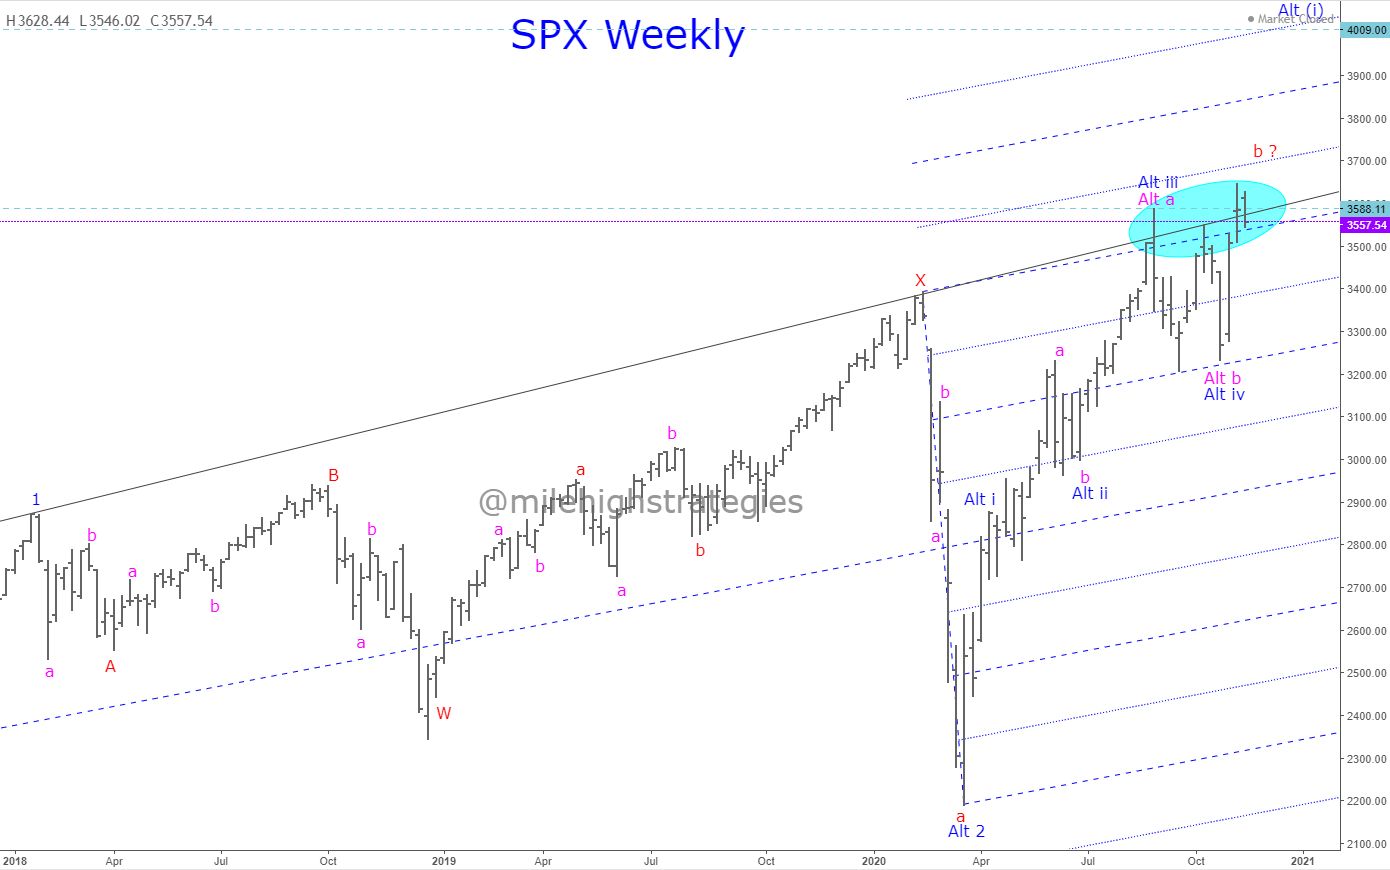
The next chart is the SPX daily chart with the nominal 20-week and 40-week FLDs, showing that only the nominal 40-week projection, made on 6.3.20, up to ~4008 remains unfilled, and a close on Monday below ~3390 would negate this projection, while a close below ~3361 would create a downward projection on the nominal 20-week FLD.
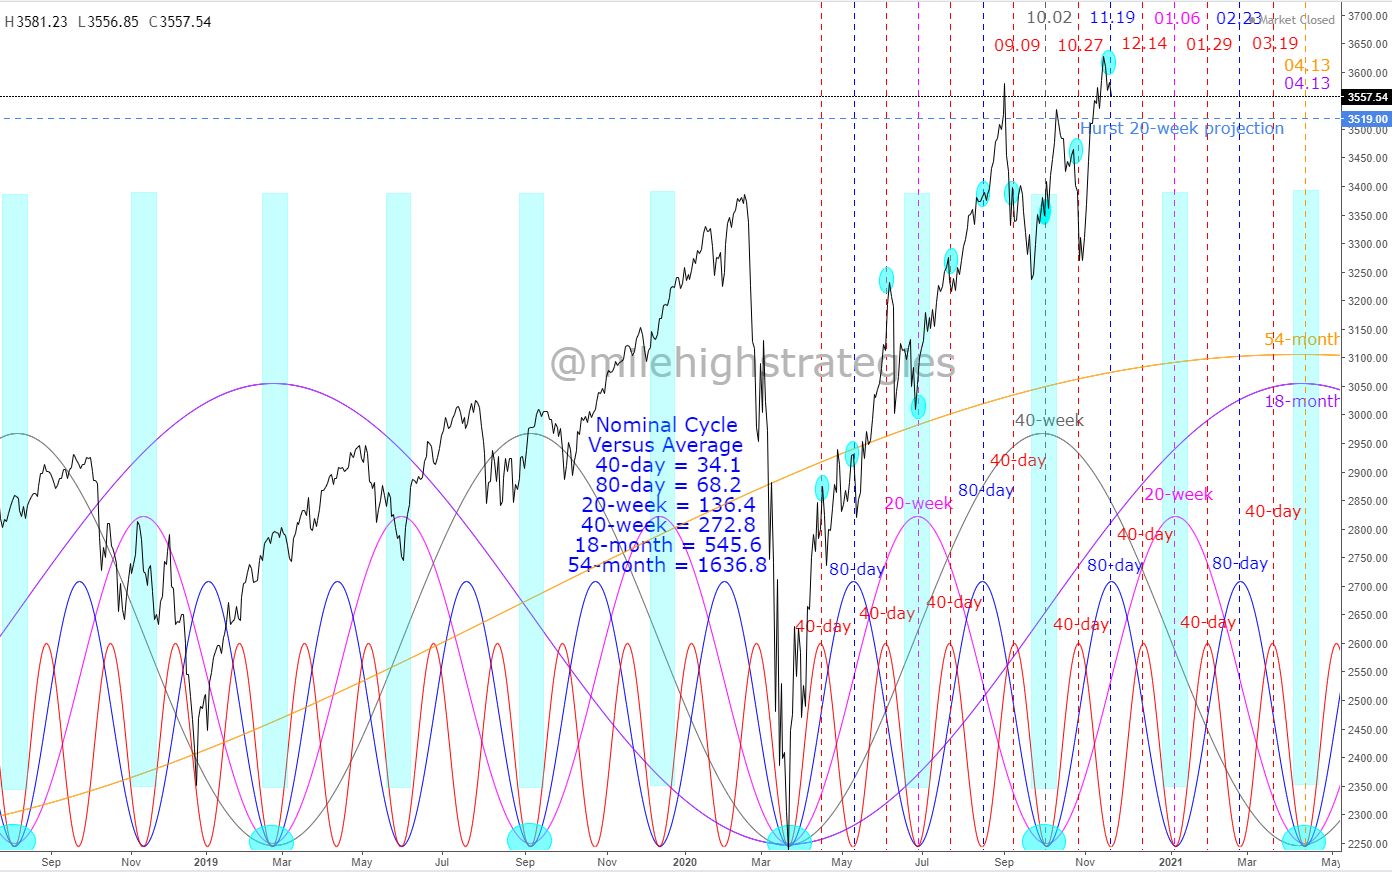
Finally, the last chart is the SPX daily chart with my take on the smaller nominal Hurst cycles, with the next inflection date on or about 12.14.20, which would be the nominal 40-day cycle peak, though there's also a nominal 20-week cycle peak just behind that on or about 01.06.21... watching.
#15
tsharp
-
- Traders-Talk User
- 1,487 posts
Member
Posted 21 November 2020 - 02:20 PM
Just a moment to present two very valid fractal interpretations...
First the bearish count that could suggest down into next spring:
Then the bullish count that could mean the SPX moves quite a bit higher into year's end:
#16
sixpack
-
- Traders-Talk User
- 62 posts
Member
Posted 23 November 2020 - 12:24 AM
Great analysis! Good stuff! I keep looking at the daily and weekly and I just can't completely shake the possibility we have some retracing to do here. We could squeak a little higher. Now when I look at the monthly it suggests a better probability of new highs next month. So it could be we have a little dip here then go higher (We're already off the highs by a fair amount). I think we could see 3800 to 3900 SPX in the next two to three months before we have a larger pullback. I have a couple of small stock positions right now and will be adding more as it unfolds (I'm just trying to catch the short bursts up). The obvious area of support is now above the November low. We'll see what happens. I see some significant upside over longer time frames in spite of all the crash calls I hear the majority of people talking about right now.


