I'm gonna call that the "Admiral Ackbar" signal for the Bears, near term!
Mark

Mark S. Young
Posted 23 November 2020 - 10:28 AM
I'm gonna call that the "Admiral Ackbar" signal for the Bears, near term!
Mark
Mark S Young
Wall Street Sentiment
Get a free trial here:
http://wallstreetsen...t.com/trial.htm
You can now follow me on twitter
Mark S. Young
Posted 23 November 2020 - 02:01 PM

Thanks Tim!
Mark S Young
Wall Street Sentiment
Get a free trial here:
http://wallstreetsen...t.com/trial.htm
You can now follow me on twitter
Member

Posted 23 November 2020 - 02:46 PM
Member

Posted 24 November 2020 - 09:27 AM
SPX DAILY HURST PROJECTIONS UPDATE
Back in February, the SPX rallied back to the UTL from the 3.2009 low to the 1.2018 high and danced on either side of that UTL for seven trading days, then was rejected by it, and promptly fell faster and farther than any time in US stock market history...
The SPX the proceeded to also recover faster from that deep of a fall, also faster than any time in US stock market history, and in September, pushed back up and through this UTL, but was rejected, and this happened again in October, and finally, here we are again, though the SPX hasn't just retreated, but has been dancing on either side of this UTL for eleven days now, closing back above it again...
This chart is the SPX daily chart with the nominal #Hurst 20-day and 40-day FLDs, showing the SPX closed just above it's nominal 20-day FLD, with both upper targets of ~3661 and ~3707, respectively, still unfulfilled...
For tomorrow, a closing below ~3573 and ~3270, respectively, would negate the upward projections, and create downward projections... watching.

Member
Posted 24 November 2020 - 10:51 AM
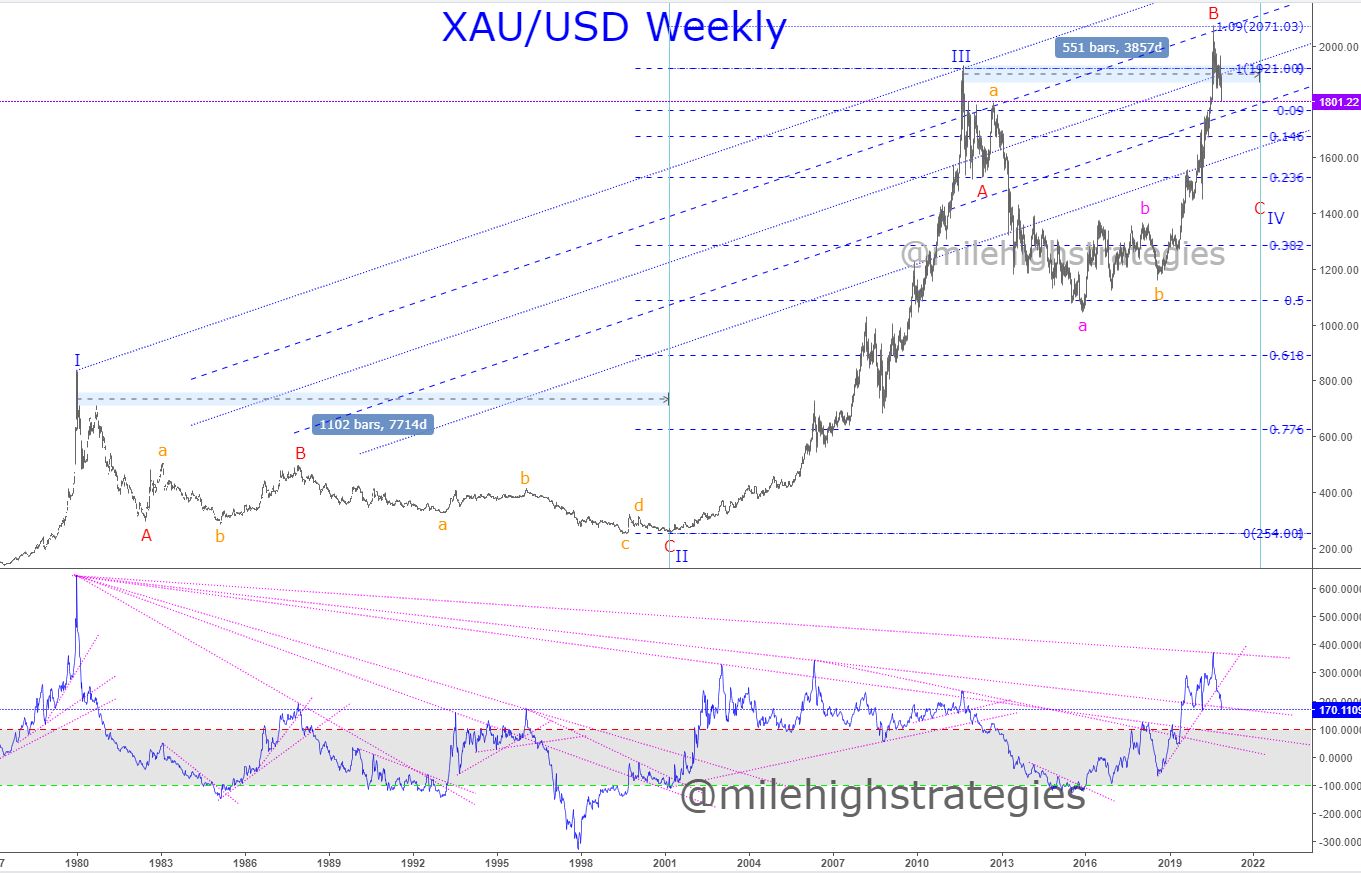
GOLD WEEKLY CHART UPDATE
I said about two months ago that it appeared to me that the US Dollar was in wave-c:2 down, with a target of ~102.
It seems the #USD has found a bottom and is rallying, and with that, XAU/USD (spot #gold priced in USD), is falling.
If my fractal interpretation is correct gold has made an IT top Wave-B:IV, and is declining in Wave-C:IV to perhaps the ~1000 range into 2022... watching.
Member
Posted 24 November 2020 - 11:35 AM
New ATHs in the NYA, Dow and RUT... watch out above!

Member
Posted 24 November 2020 - 12:44 PM
Dow 30K... with possible ST targets above!

Member
Posted 24 November 2020 - 12:57 PM
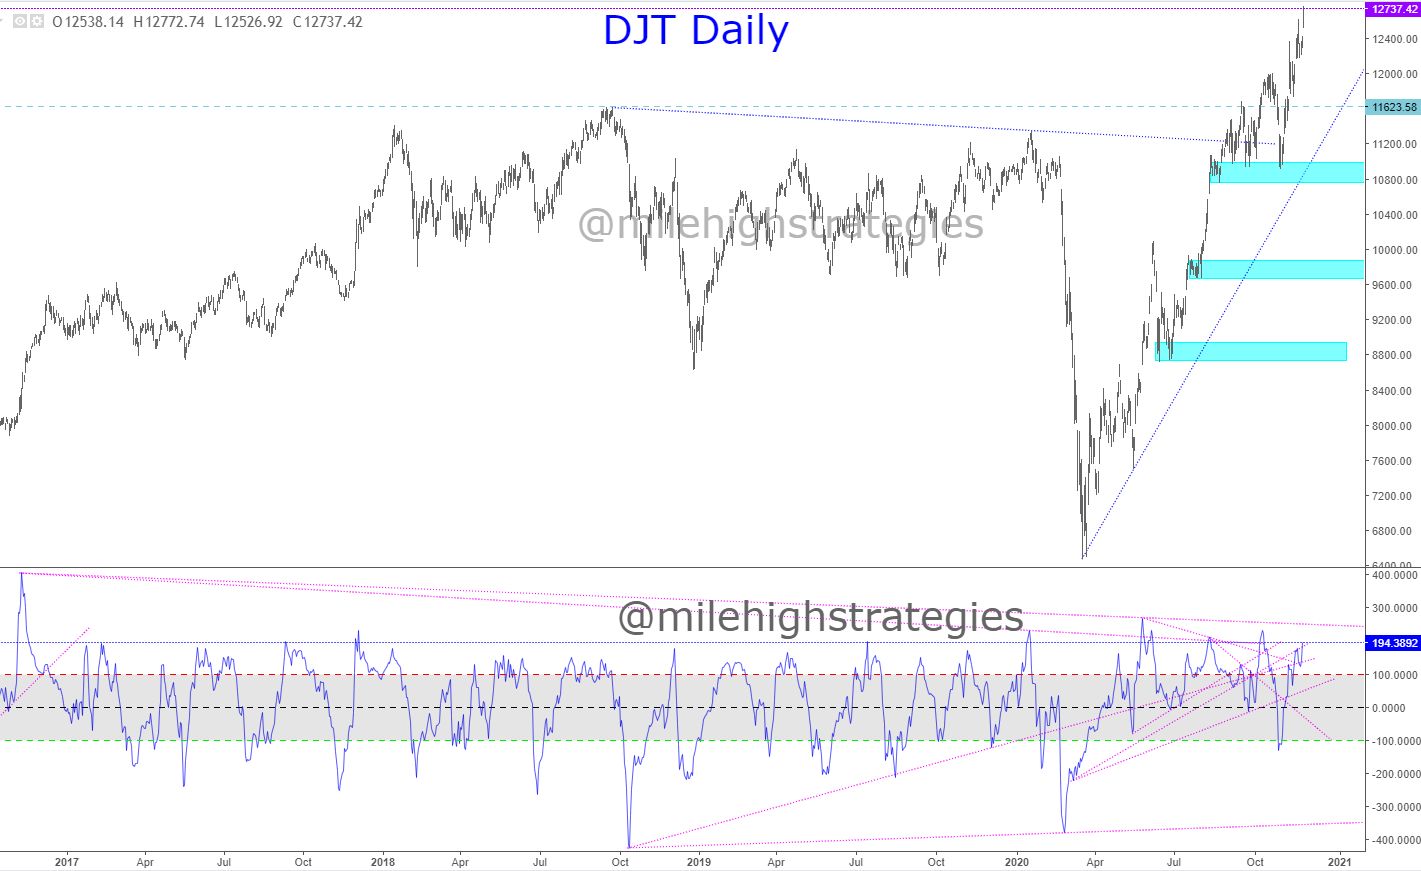
And with the DJT pushing to new ATHs also today, that makes another Dow Theory confirmation.
Member


Posted 24 November 2020 - 01:01 PM
Average returns for the coming week have been positive by all measures.


