What about 2010-2019?
Not sure. Didn't see any more current records.
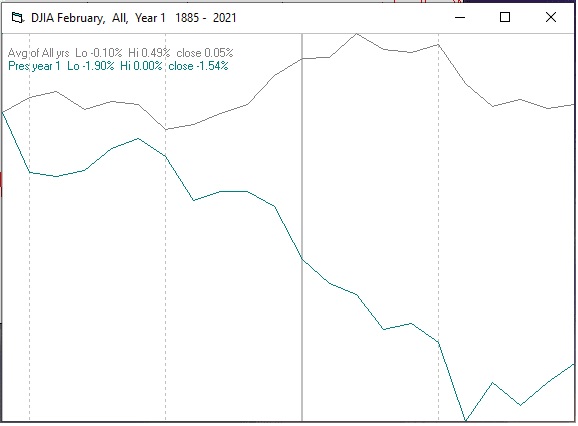
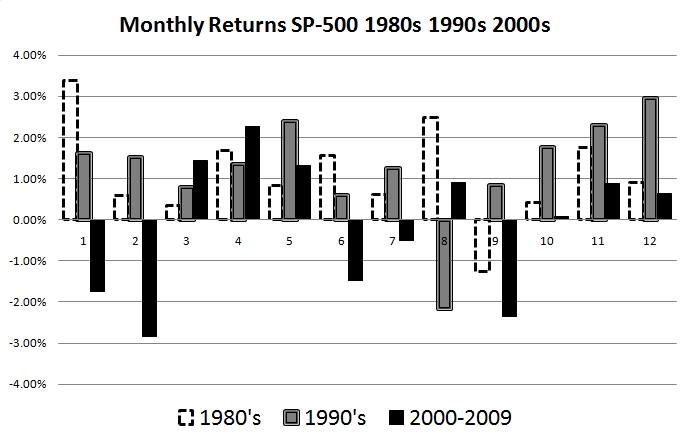
To me, these seasonal charts simply show historical seasonal patterns.
And they do vary a bit from decade to decade.La Niña and El Ni·ño can vary climate expectations from year to year.
So can the FED and Janet Yellen.
"Beware the Ides of March" and "Go Away in May" and the "Santa Clause" rally often work out in stock trading, but not always.
Not much different than seasonal weather patterns which we observe but they do not show tomorrow's weather forecast.
Right now, I have all of my shorts and t-shirts packed away because It is still winter in the Northern Hemisphere.
I have been in Kansas City for the 4th of July and the high temperature was in the 50's and so much fog that the fireworks were cancelled.
But I did not need my winter coat.
Mike Burk Notes:
"Conclusion:
All-time highs confirmed by breadth are usually followed by additional new highs in the following six weeks.
On average, during the first year of the Presidential Cycle, the first week of February has been modestly positive followed by the worst two weeks of the year.
I will go with that as my forecast for the next three weeks."
Watching for sentiment extremes can be useful in the short term just as a ship's captain should watch a barometer to foresee storms.
Edited by Rogerdodger, 03 February 2021 - 01:27 AM.