3900 SPX possible

We may close on the high of the day
Started by
q4wer
, Feb 05 2021 10:58 AM
9 replies to this topic
#2

q4wer
-
- Traders-Talk User
- 2,179 posts
Member
Posted 05 February 2021 - 11:02 AM
NQ needs to break up above NQ 13585 to fulfill the SPX 3900 goal.
#3
q4wer
-
- Traders-Talk User
- 2,179 posts
Member
Posted 05 February 2021 - 11:03 AM
I hope that QQQ closes on 332, about 1.5 away.
#4
12SPX
-

- Traders-Talk User
- 12,554 posts
Member
Posted 05 February 2021 - 12:01 PM
I'm thinking the opposite but should be interesting, market looks tired to me.
#5
slupert
-

- Traders-Talk User
- 2,803 posts
Member
Posted 05 February 2021 - 01:28 PM
I'm thinking the opposite but should be interesting, market looks tired to me.
That's what I'm thinking.
#6
slupert
-
- Traders-Talk User
- 2,803 posts
Member
Posted 05 February 2021 - 01:32 PM
I am seeing negative divergences in ES and NQ's any body else?

#8
tsharp
-

- Traders-Talk User
- 1,487 posts
Member
Posted 05 February 2021 - 06:43 PM
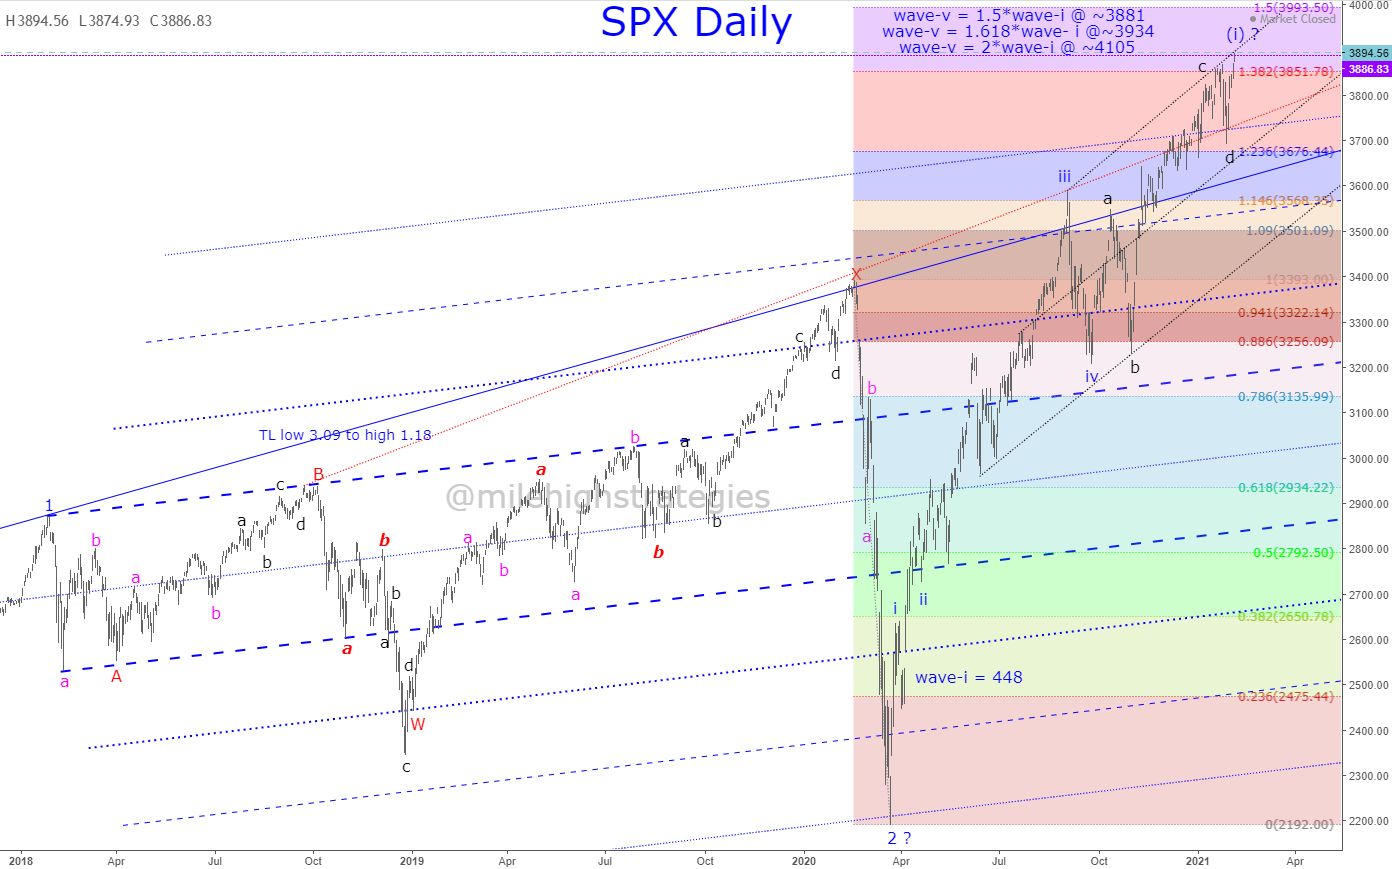
Here's the SPX daily with my Wave-2 channel; clearly the market wants to go higher, though at some point, wave-(i):3 will find a top, and an IT top will be found for a wave-(ii):3 correction, though it can continue upward to those Hurst nominal 20-week and 40-week targets at ~4008 and ~4406, respectively.
#9
tsharp
-
- Traders-Talk User
- 1,487 posts
Member
Posted 06 February 2021 - 01:39 PM
SPX DAILY CHART UPDATE
The basis of my work is the trend line of the moment indicator line, and last week when it declined to its UTL, I said that either it would bounce from there and even extend the upward trend to new ATHs, or it would continue downward and mark an IT top was in place...
It did bounce, and the price did also push upward to new ATHs, so what's next?
I revised the time measurement tool to show the present negative divergence of momentum versus price off the March 2020 lows is at 248-days, which is still about 2-months less than the two previous times that lasted 308-days and 313-days, respectively - so if this push last a comparable period, we would be looking for a final price peak out in the first week of April, which is more in line with my #Hurst cycles analysis... watching.


#10
tsharp
-
- Traders-Talk User
- 1,487 posts
Member
Posted 07 February 2021 - 01:25 PM
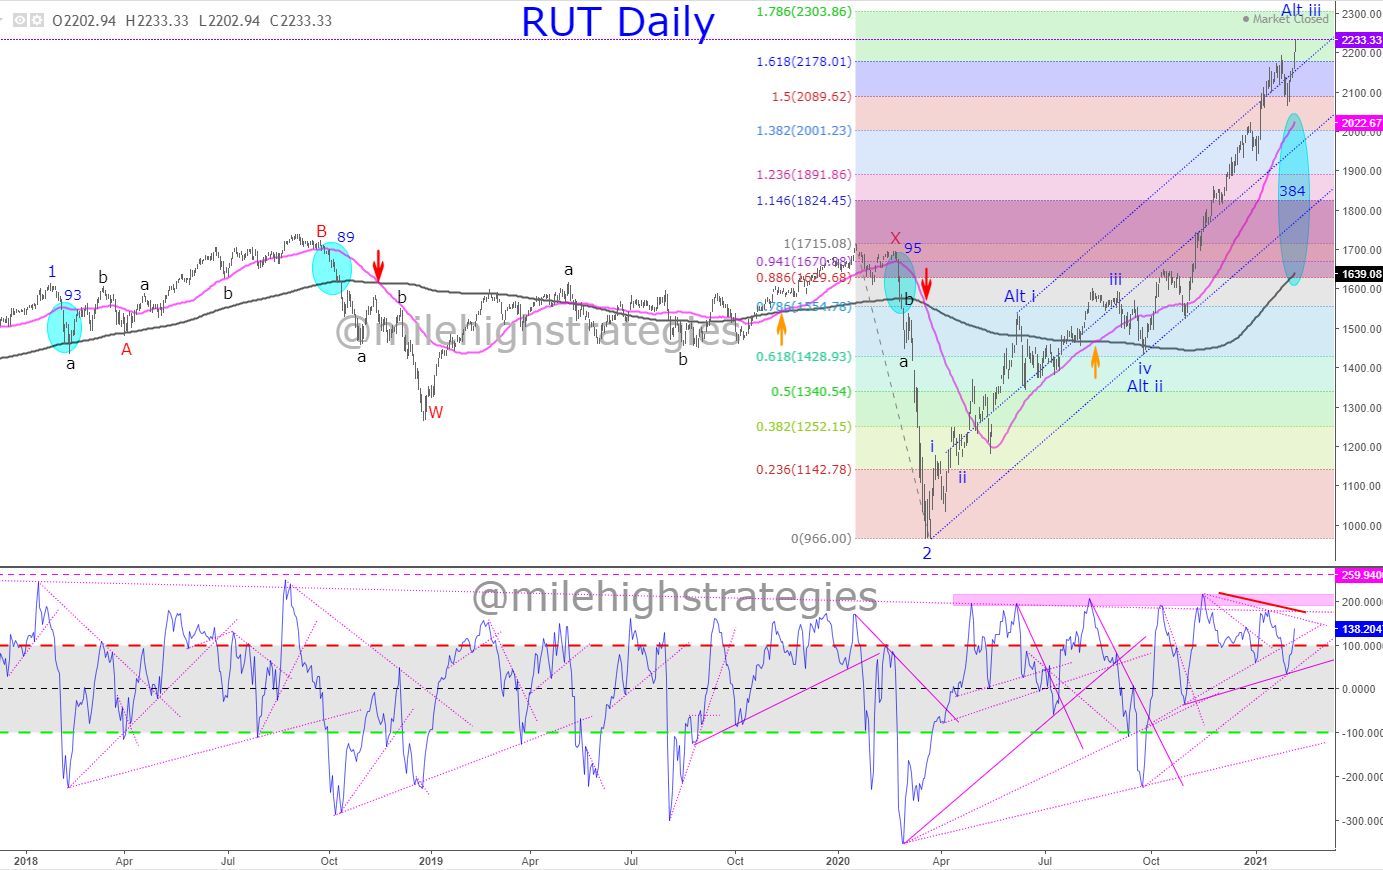
Here's the RUT daily with an alt fractal count I offered my folks today: