crash them bonds......

GAME OVER - BOND MARKET IS BROKEN !
Started by
SemiBizz
, Feb 25 2021 04:06 PM
16 replies to this topic
#11

da_cheif
-

- Traders-Talk User
- 10,960 posts
Member
#12
tradesurfer
-

- Traders-Talk User
- 2,944 posts
Member
Posted 25 February 2021 - 08:56 PM
Dont tell Steven Van Metre He is still expecting Rates to to to negative and a massive TLT bond rally to 200+, the dollar to spike up super fast, and stock market to crash.
He said that once before he had his entire net worth in Bonds and was suffering a draw down of 60% but held onto the position until it rallied for him and he gained 100+ %
#13
da_cheif
-
- Traders-Talk User
- 10,960 posts
Member
Posted 25 February 2021 - 09:06 PM
Dont tell Steven Van Metre He is still expecting Rates to to to negative and a massive TLT bond rally to 200+, the dollar to spike up super fast, and stock market to crash.
He said that once before he had his entire net worth in Bonds and was suffering a draw down of 60% but held onto the position until it rallied for him and he gained 100+ %
poor steven only claim to fame is he was an Eagle Scout.....lol.....justa nother hussman.....but this time this youngster lacks experience......a hack when i comes to the stock market
#14
Rogerdodger
-

- TT Member*
-

- 26,870 posts
Member
Posted 25 February 2021 - 10:09 PM
From T Theory: https://ttheorygroup.science.blog/
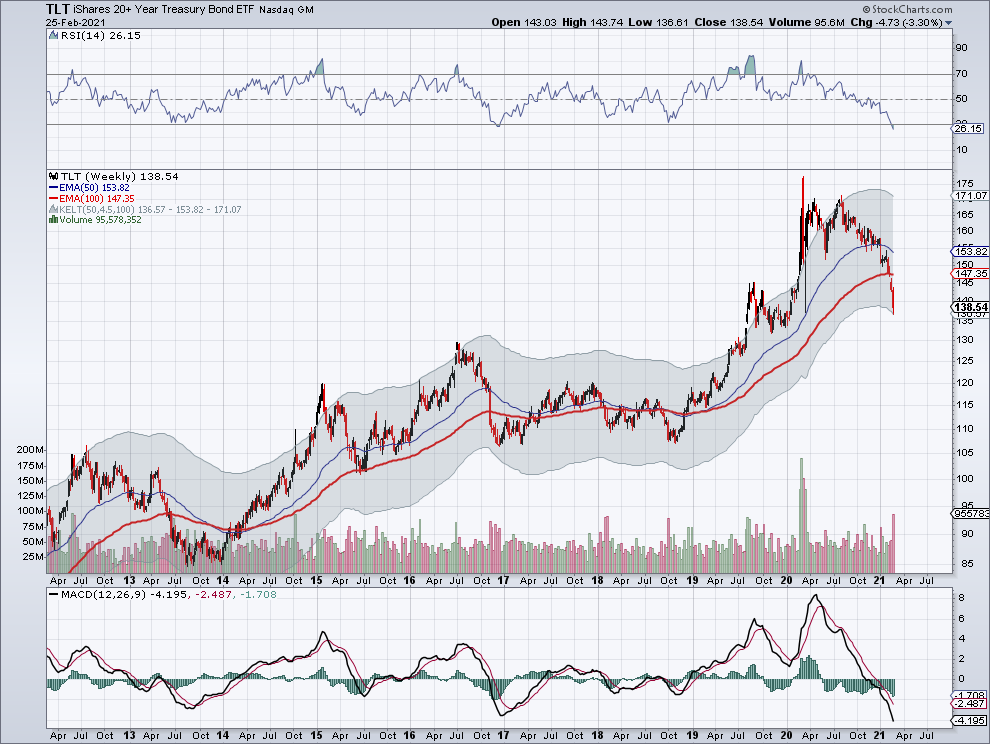
"Many years ago, Terry Laundry developed his Optimum Moving Average concept. For Interest Rates, his weekly chart used 100 weeks for its Optimum Moving Average. Personally I found more hits at the 50 week average. Today we hit the bottom of the 50 week Keltner bands at 136.61 intra-day. The lower band of the 50 week Keltner is 136.57. This is another example of how we often move to the mid or lower Keltner bands after exceeding the peak and starting a move inside the bands."
Notice that we might get some stability based on being oversold now (see the red circles). But the chart’s T continues through this year.
Edited by Rogerdodger, 25 February 2021 - 10:10 PM.
"Nature's Failure to Function in a 'Predictable Way'... 500 years ago?"
BIGGEST SCIENCE SCANDAL EVER...Official records systematically 'adjusted'.
BIGGEST SCIENCE SCANDAL EVER...Official records systematically 'adjusted'.
#15
Russ
-

- Traders-Talk User
- 7,193 posts
Member
Posted 26 February 2021 - 12:57 AM
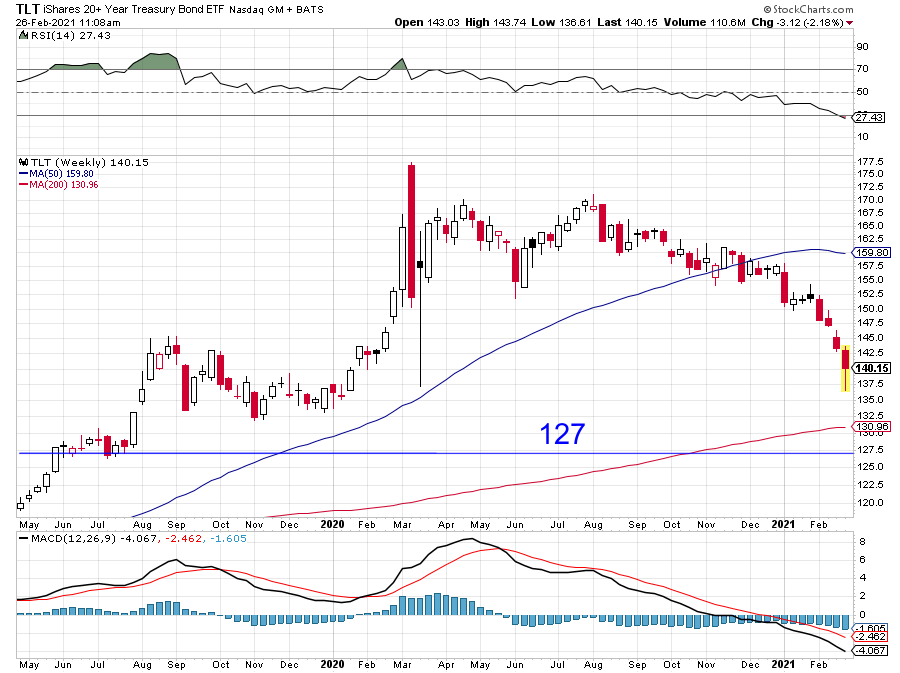
A hell of a bull flag...
"Nulla tenaci invia est via" - Latin for "For the tenacious, no road is impossible".
"In order to master the markets, you must first master yourself" ... JP Morgan
"Most people lose money because they cannot admit they are wrong"... Martin Armstrong
http://marketvisions.blogspot.com/
"In order to master the markets, you must first master yourself" ... JP Morgan
"Most people lose money because they cannot admit they are wrong"... Martin Armstrong
http://marketvisions.blogspot.com/
#16
steadyquest
-

- Traders-Talk User
- 775 posts
Member
Posted 26 February 2021 - 11:48 AM
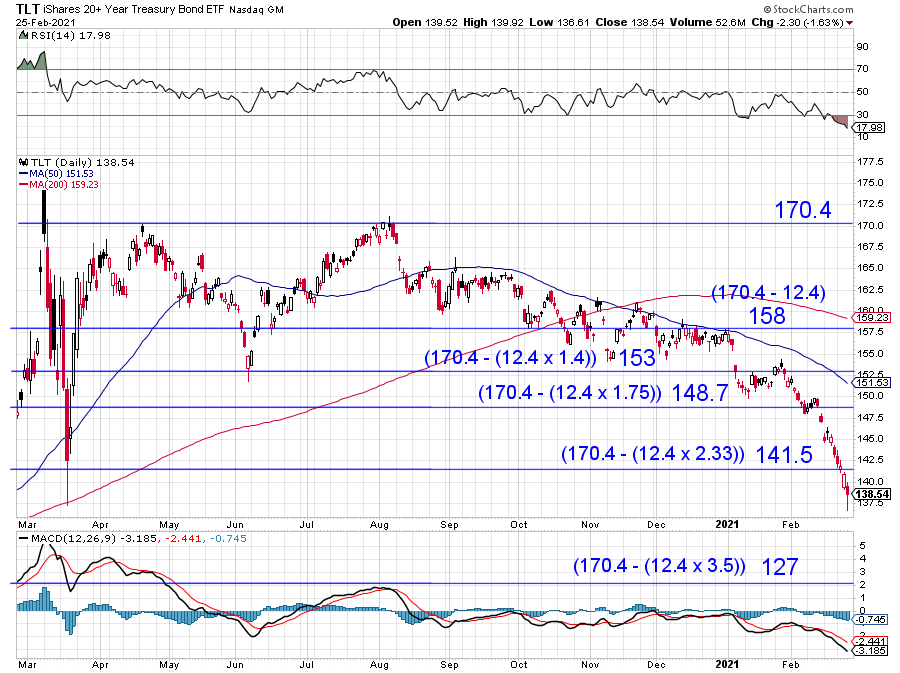
The TLT count that I posted yesterday exhibits a retrace following the 1.4 level, and the smallest count that does not generate a retrace might be as shown below - although there is little reaction at the 2.33 level - so who knows...
#17
steadyquest
-
- Traders-Talk User
- 775 posts
Member
Posted 28 February 2021 - 12:37 PM
Okay - final answer - the below is possibly the smallest count with no retrace, but my measurements lack the precision to call it. A retest of the 2.33 level next week (or later) should provide another datapoint..


