If new lows next week, then we could see 3,000 or less in March.
I don't understand UVXY weakness here, it's only 1.5x leverage, puts may be better,
just cheap crash puts, not ITM.
Edited by CLK, 26 February 2021 - 05:37 PM.

Member
Posted 26 February 2021 - 05:35 PM
If new lows next week, then we could see 3,000 or less in March.
I don't understand UVXY weakness here, it's only 1.5x leverage, puts may be better,
just cheap crash puts, not ITM.
Edited by CLK, 26 February 2021 - 05:37 PM.
Member

Posted 27 February 2021 - 05:18 AM
3000 ? sorry, but no chance. And probably the dip is over or nearly over
Edited by andr99, 27 February 2021 - 05:19 AM.
forever and only a V-E-N-E-T-K-E-N - langbard
Member

Posted 27 February 2021 - 07:19 AM
Member
Posted 27 February 2021 - 08:46 AM
Member

Posted 27 February 2021 - 09:58 AM
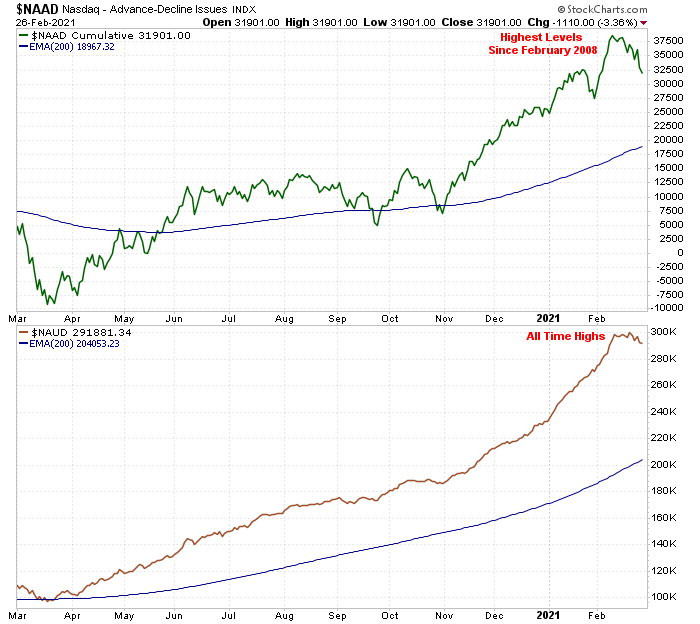
Look at the NASDAQ rally from March
How doesn't that look like a 3 wave rally
"3rd waves are ''wonders to behold'' and for many good reasons. Technically, this is the time where most analysts throw in the towel as price is now confirming what the internals told the analyst during wave 1 which was a change in direction was probable. This is also the time in which extremes in many indicators will show up - something in which I refer to as ''flags'' - which are later used in approximating the termination point of the entire 5 wave pattern sequence structure. In equities, these extremes will be measured in the raw data of both breadth and volume - and the strength or weakness of the indicators that use such information - as well as their relationship to each other. Price pattern wise, one will always be able to identify a third wave because of the fact that price patterns will break out of basic support or resistance areas that were previously controlling the price pattern up until that time. Psychologically, this is when the mind set is that we remember how we all got burned before and that in no way is this the start of a major move higher - also known as climbing the ''wall of worry''. Once the market gets high enough, people start throwing in the towel on their bearish mind set, and this continues to a point when all of the ''willing'' buyers are in the market. 3rd waves are also never the shortest wave in a 5 wave structure, and more times than not, are generally the longest wave in either price, percentage gain, or both, to what will eventually be the larger 5 wave pattern structure sequence overall."
Better to ignore me than abhor me.
“Wise men don't need advice. Fools won't take it” - Benjamin Franklin
"Beware of false knowledge; it is more dangerous than ignorance" - George Bernard Shaw
Demagogue: A leader who makes use of popular prejudices, false claims and promises in order to gain power.
Technical Watch Subscriptions
Member

Posted 28 February 2021 - 07:14 AM
They Key with the VIX is that the large opening gap of February 24, 2020 was never able to get filled. It held as support.
The VIX on a day to day basis is tough to read... it can explode at any moment.
If new lows next week, then we could see 3,000 or less in March.
I don't understand UVXY weakness here, it's only 1.5x leverage, puts may be better,
just cheap crash puts, not ITM.
Member
Posted 28 February 2021 - 03:11 PM
Look at the NASDAQ rally from March
How doesn't that look like a 3 wave rally
"3rd waves are ''wonders to behold'' and for many good reasons. Technically, this is the time where most analysts throw in the towel as price is now confirming what the internals told the analyst during wave 1 which was a change in direction was probable. This is also the time in which extremes in many indicators will show up - something in which I refer to as ''flags'' - which are later used in approximating the termination point of the entire 5 wave pattern sequence structure. In equities, these extremes will be measured in the raw data of both breadth and volume - and the strength or weakness of the indicators that use such information - as well as their relationship to each other. Price pattern wise, one will always be able to identify a third wave because of the fact that price patterns will break out of basic support or resistance areas that were previously controlling the price pattern up until that time. Psychologically, this is when the mind set is that we remember how we all got burned before and that in no way is this the start of a major move higher - also known as climbing the ''wall of worry''. Once the market gets high enough, people start throwing in the towel on their bearish mind set, and this continues to a point when all of the ''willing'' buyers are in the market. 3rd waves are also never the shortest wave in a 5 wave structure, and more times than not, are generally the longest wave in either price, percentage gain, or both, to what will eventually be the larger 5 wave pattern structure sequence overall."
Member
Posted 03 March 2021 - 09:05 PM
Member
Member

Posted 03 March 2021 - 11:47 PM
QQQ 275 seems like a good place for a bounce if we're going to keep going down, that'd be about a 10% move... doubt in a day. Maybe the Fed's going to have to start buying stocks directly?


