The BUFFET LETTER is out with a strong backing for US stocks after a week when the bulls lost ground and tech was hammered.
BOND folks calling the FED's bluff will end only one way: the FED will win.
https://www.cnbc.com...sed-assets.html

Member
Posted 27 February 2021 - 11:48 AM
The BUFFET LETTER is out with a strong backing for US stocks after a week when the bulls lost ground and tech was hammered.
BOND folks calling the FED's bluff will end only one way: the FED will win.
https://www.cnbc.com...sed-assets.html
Member
Posted 27 February 2021 - 12:00 PM
A great week for, 10 consecutive days of profit, some quite modest but the last two weeks required all the
trading skills I possess to outwit this manic market. I held PUTS, cashed out on the drop, then traded mostly CALLS and QQQ and
profited from the bounce. This is to be one of the best January/February trading performance for me since... maybe 2016 or 2009...
I intend to reopen more LONGS - CALLS, QQQ, maybe VWO, and possibly XLF or KRE, because this may be the best opportunity to buy for some time as the
US and other major global economies come out of the year-long pandemic. Markets may go down another 5 to 7 % but will be roaring back into the Spring and Summer, and even further down the road as the global vaccine rollout successfully returns some sense of normalcy in most sectors of the economy.
BUT, excessive exuberance will give away to reality in August to October -- expect a huge drop in the markets.
SPX 4200 before 3000 during the rest of 2021.
500 qqq
13 qqq calls
16 spy calls
1 nq hedge short
Member
Posted 27 February 2021 - 12:03 PM
Member
Posted 27 February 2021 - 12:05 PM
Member
Posted 27 February 2021 - 12:07 PM
Edited by dTraderB, 27 February 2021 - 12:07 PM.
Member
Posted 27 February 2021 - 12:10 PM
buy SMALL CAPs?
"...The message of this relationship is that corporate profits should continue to improve throughout 2021 and into 2022. Having the economy open back up again after Covid starts to abate should no doubt help to fuel this recovery.
If and when the Fed starts to wake up to the inflation monster that the Fed has fueled, and starts to increase short term rates in response, then that de-steepening of the yield curve is going to matter for small caps and for the larger economy. But the 15-month lag time will be a factor, so don’t expect an immediate effect. All of the excess stimulus that the Fed is still pumping is going to have a lasting effect, no matter what changes they make now. And the longer they wait to take action, the longer the effect’s duration will be."
https://www.mcoscill...and_small_caps/
Member
Posted 27 February 2021 - 12:12 PM
SPAC bubble explosion will be quite painful to bulls ...

Member
Posted 27 February 2021 - 12:16 PM
Let's look at the chart of the Nasdaq Composite using a leading indicator like RSI.
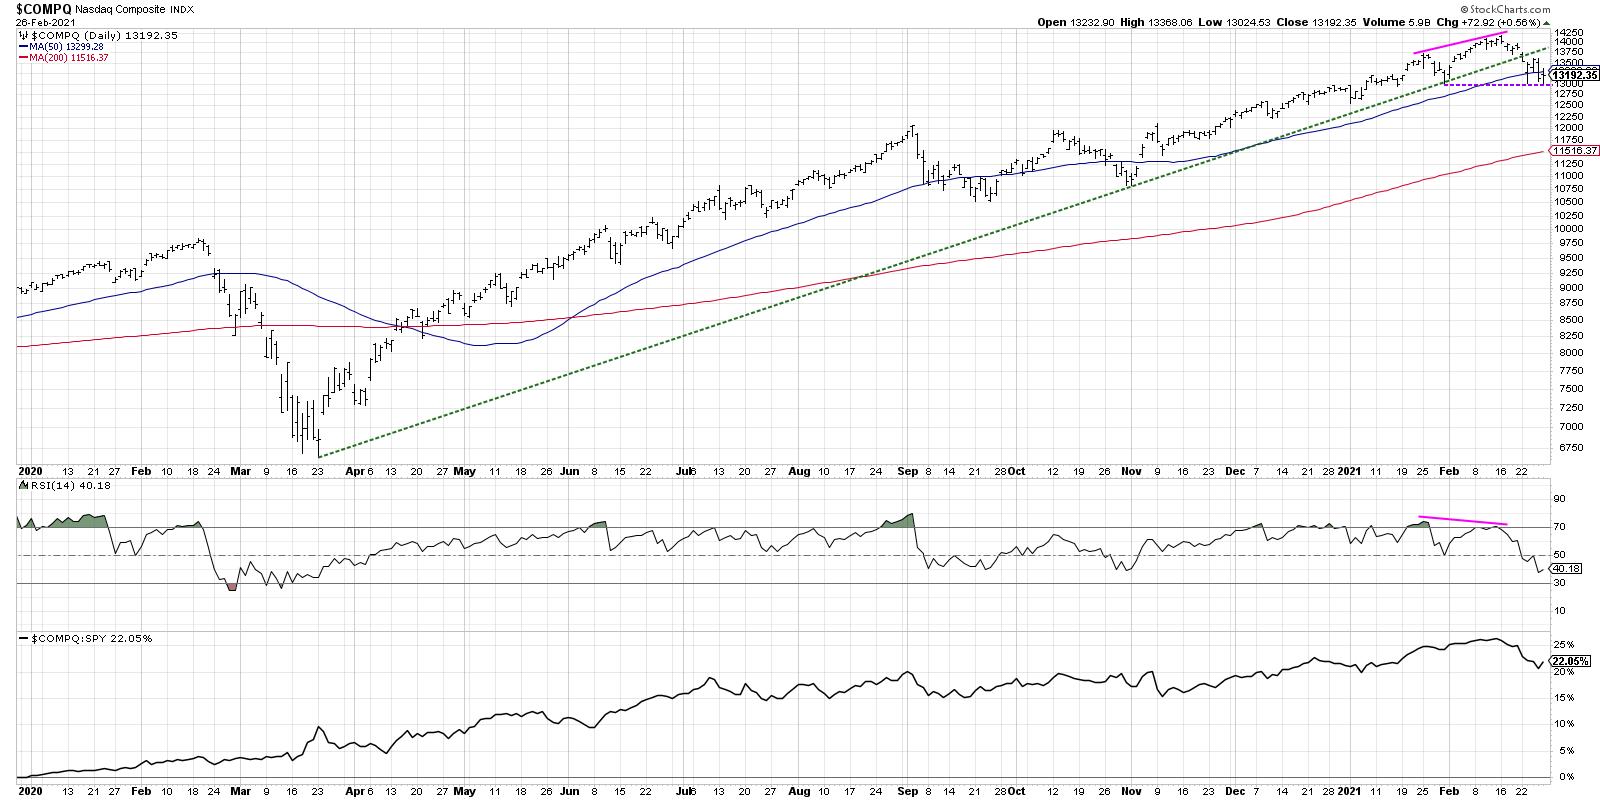
A healthy uptrend will show higher highs in price as well as higher highs in momentum. As the price moves ever higher, the RSI should continue to push higher as well. But, towards the end of a bullish trend, you'll often see a bearish divergence, with higher prices and lower RSI.
The pink lines show the recent phenomenon where the January and February highs have increased, while the RSI is sloping downwards over the same period.
You may ask, "Did we get a bearish divergence like this in January and February 2020?" and the answer is, "Absolutely we did."
https://stockcharts....earish-313.html
Member
Posted 27 February 2021 - 12:20 PM
SCREAMING!!! he says...
This Time-Tested Theory is Screaming To Buy NOW
"If the economy is expected to strengthen, the LAST thing you want to do is sell stocks. Yet we just saw the NASDAQ 100 ($NDX) tumble 4.94% last week, its second worst week since the bottom formed in March 2020.
There was one common denominator when looking at both weeks, however. They both occurred the week after options expired and during the historically-bearish calendar week of the 19th to 25th. Here are the S&P 500's historical daily returns by calendar day of the month:
Considering that the S&P 500 has returned roughly 9% per year since 1950, the annualized returns above ALL fall below this average return. That's 7 consecutive calendar days of underperformance.
Given this information, now let's look back at those two bad weeks since the March low.
The NASDAQ 100 lost 4.94% from February 22nd through February 26th. The only worse week was October 22nd through October 26th. Those same calendar days did it again. One thing we have to at least consider is that much of this selling very well could be attributable to options expiration. Throw in profit-taking and fear-mongering by the media (rising yields) and the result was a 5% drop.
Instead of running scared after a much overdue pullback, how about we consider one of the biggest long-term truths relating to stock market performance?
The Dow TheoryCharles Dow developed a very basic and fairly easy-to-follow approach to trading: the Dow Theory. It centered upon the theory that the stock market, as a whole, was a reliable measure of overall business conditions within the economy and that, by analyzing the overall market, one could accurately gauge those conditions and identify the direction of major market trends and the likely direction of individual stocks. A major part of the Dow Theory discusses the significance of indices confirming one another. Dow used the Dow Jones Industrial Average ($DJI) and Dow Jones Transportation Average ($TRAN) as two key indices to follow. Industrials would be a great way to assess economic activity and transports like railroads should profit from moving the freight. It's a very simple, yet brilliant approach to determining the sustainability of an uptrend, in my view."
https://stockcharts....s-scre-450.html
Member
Posted 27 February 2021 - 12:21 PM
Broader market bias will also have a hand in whether you should ditch your stock and wait for better times, and it's important to have a strong idea of where the market's area of support is and whether it's been broken.
DAILY CHART OF NASDAQ COMPOSITE INDEX ($COMPQ)
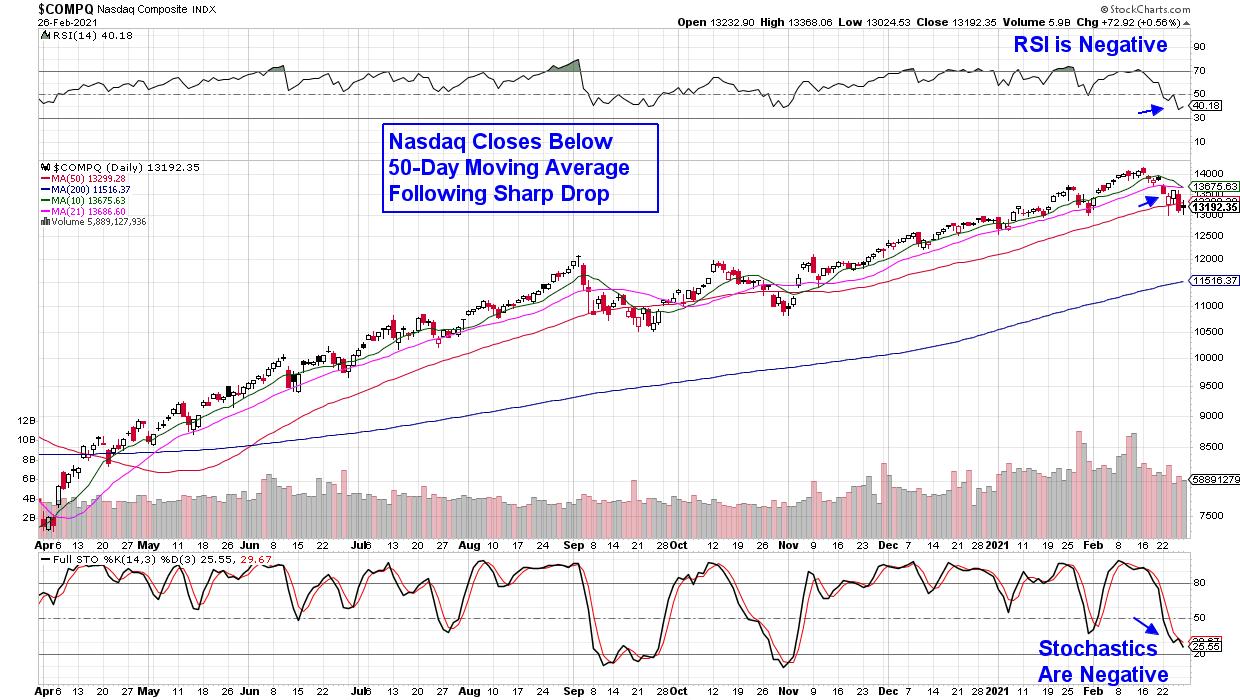
But when reviewing your individual holdings, you'll want to be on the lookout for signs of heavy institutional selling which will be signaled by above average volume. Volume alone won't tell the story, however. If the stock breaks below its 50-day moving average in heavy volume and can't rally back above it by week's end, it's a signal that buying demand is drying up and the stock's run may be ending.
These institutions can take weeks to unload their position, and it's a good idea to sell your stock if it breaks below this key level as, historically speaking, more downside is likely ahead.
https://stockcharts....time-t-215.html


