Partial Quote from the Previous Week:
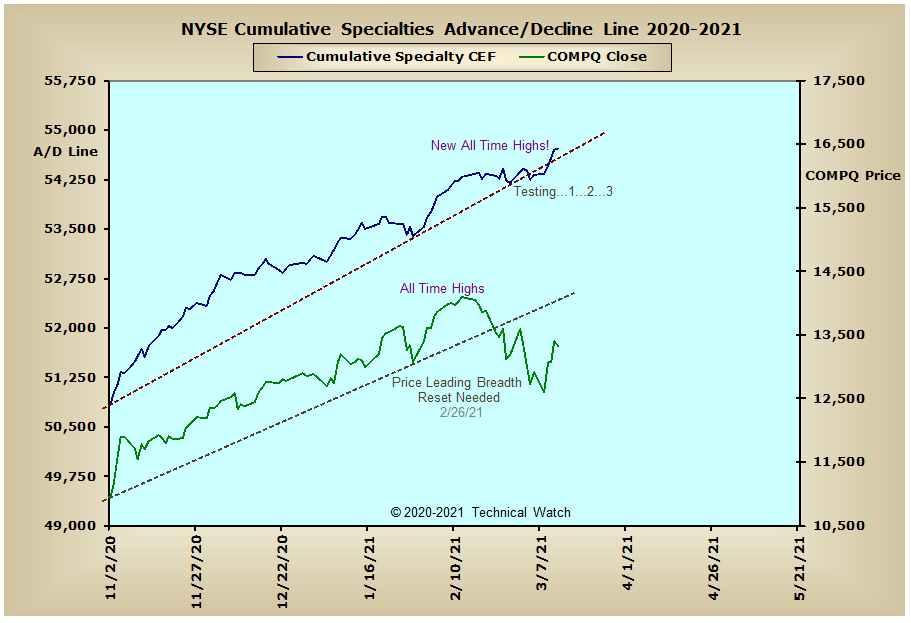
In any event, last week's rocking and rolling did quite a bit of technical good for the NASDAQ Composite Index as it continues to relieve its highly "overbought" condition. This included the NASDAQ Open 10 TRIN which finished the week at its highest "oversold" levels (1.02) since the October 2019 bottom (yes, even beyond that of the COVID crash lows). Along with NASDAQ breadth MCO (-94) and the NASDAQ volume MCO (-119) spiking deeply into "oversold" territory on Thursday, this now suggests that all of the willing sellers are now out (or nearly so) which only leaves the "unwilling" sellers to provide the bullish divergences necessary for a potential Elliott 5th wave run to the upside between April and June of this year.
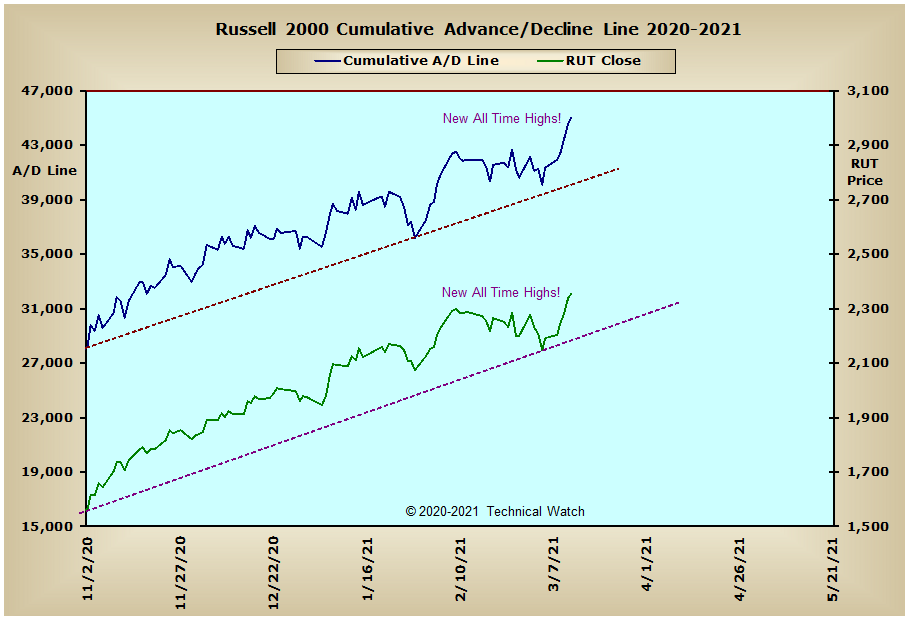
With large cap equities showing a new burst of strength on Thursday, the major market indices finished higher again for the week with an average gain of +4.25% as the S&P 400 MID Cap Index (+5.31%) and the S&P 600 Small Cap Index (+7.34%) continued to lead the broader market into record territory.
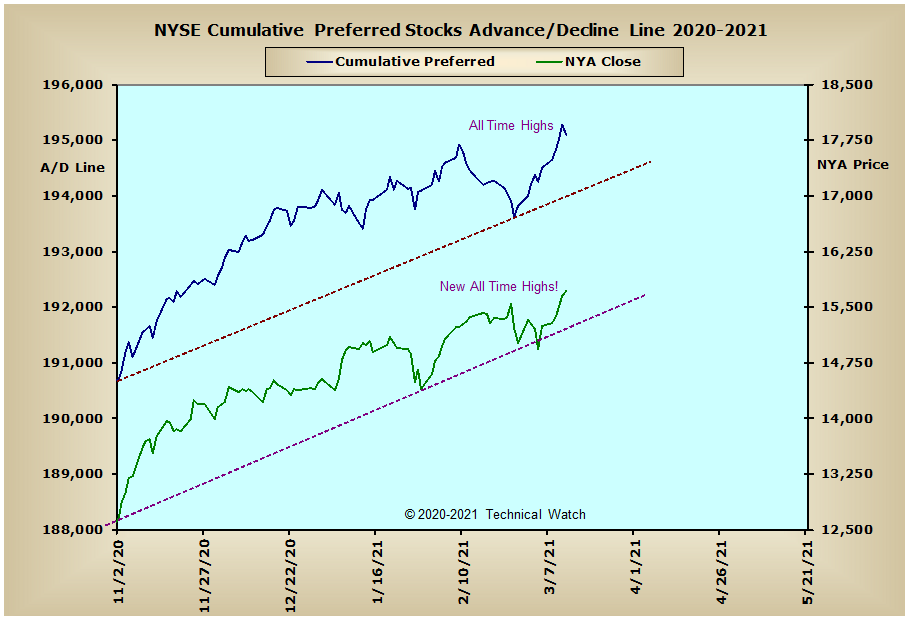
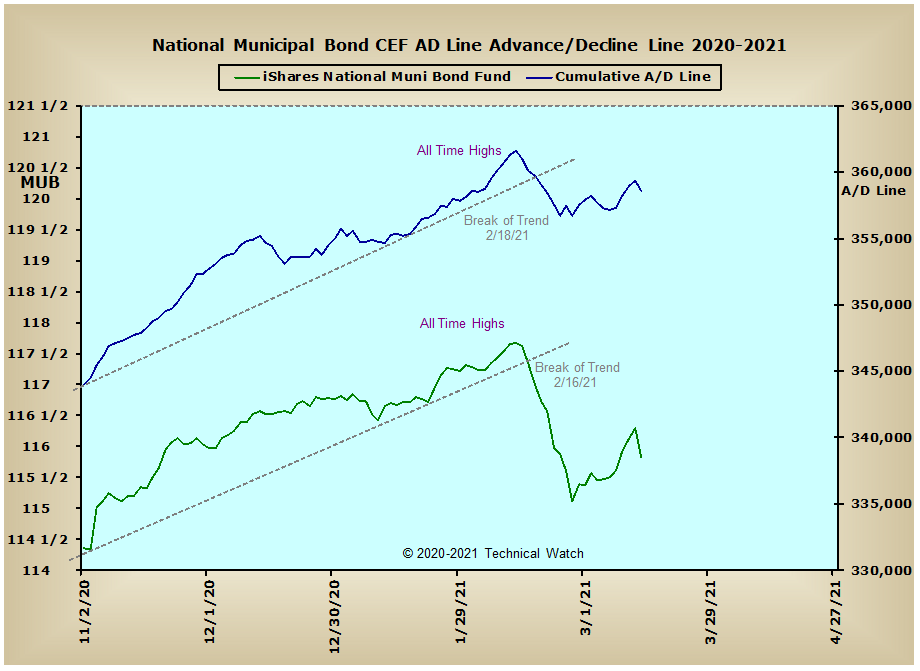
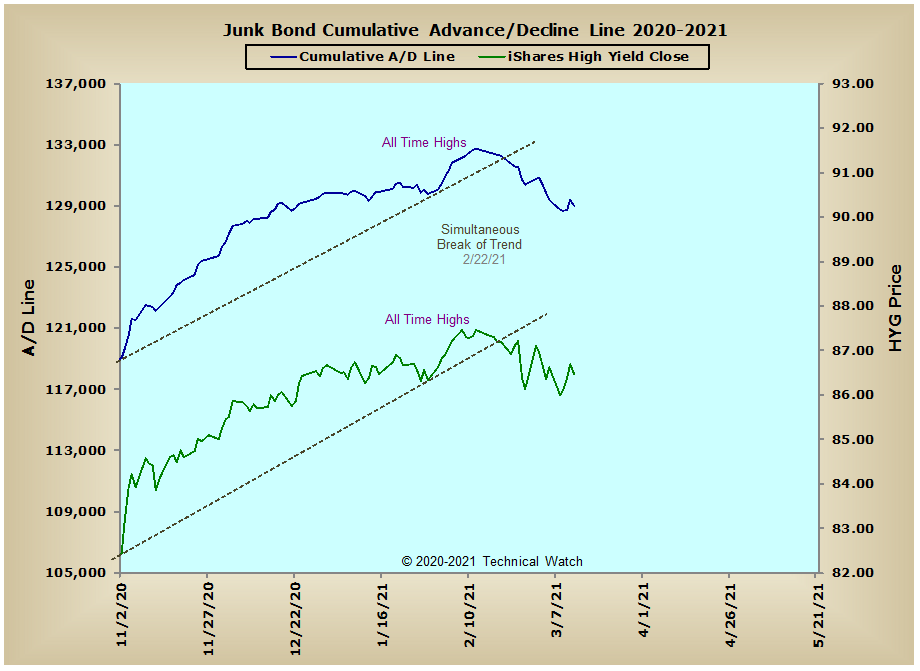
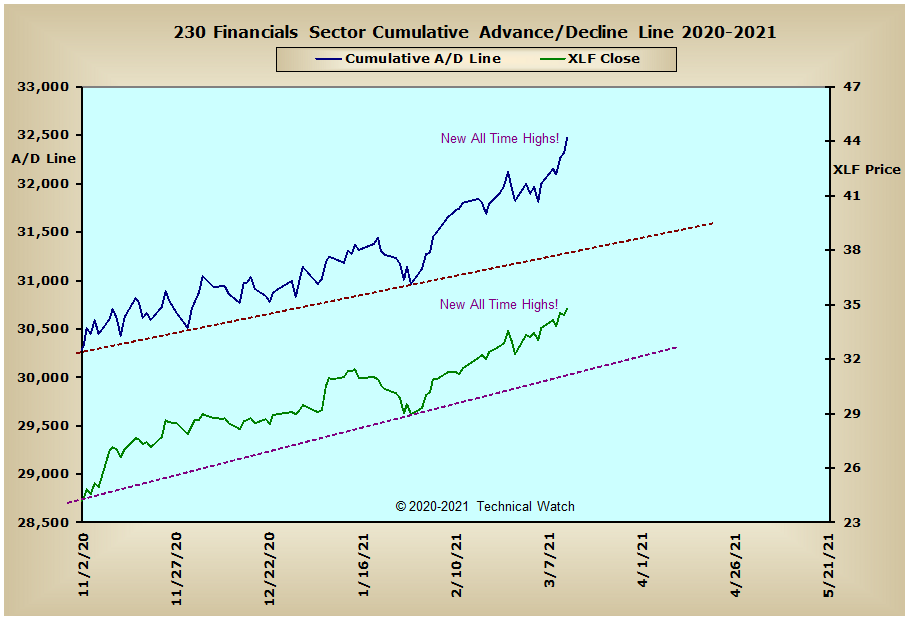
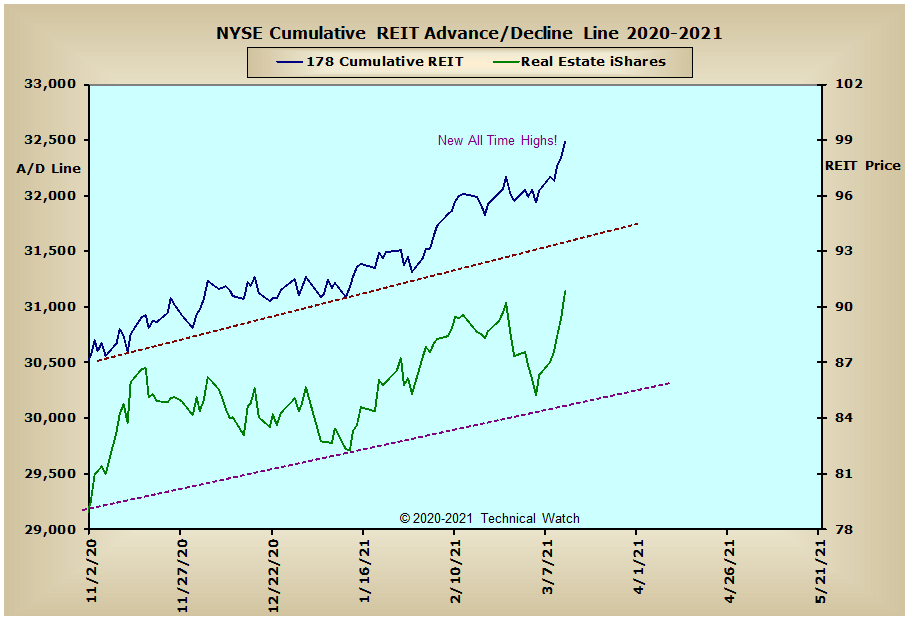
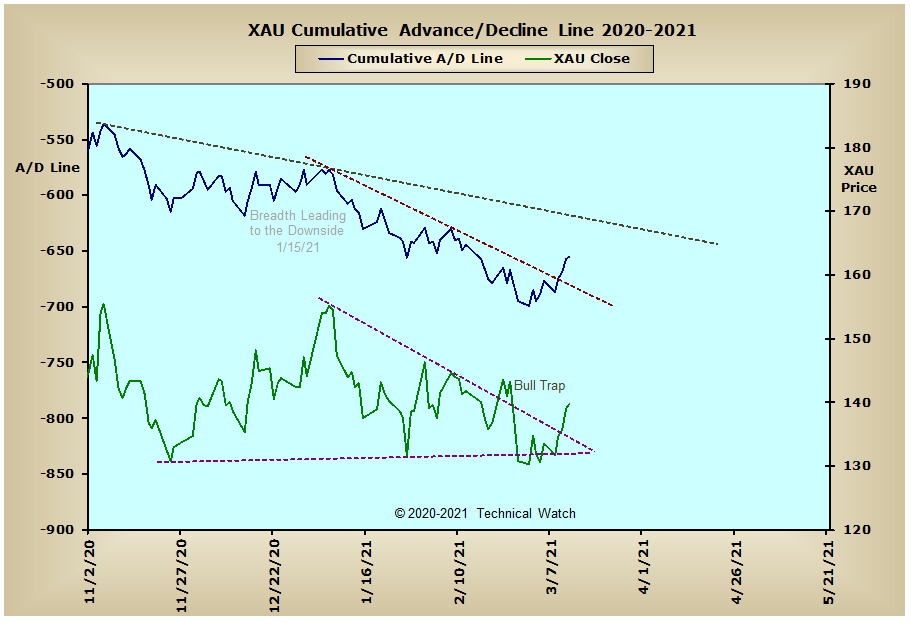
With the significance of Thursday's sharp rally not to be taken lightly, new all time cumulative highs in breadth were seen across a wide variety of market products. Even the Precious Metals and XAU advance/decline lines both registered breakouts above their accelerated declining tops lines in this same effort. This same break above trendline resistance also took place with Germany's DAX advance/decline line which pushed the price index itself into record high territory. With France's CAC advance/decline line now 17 net advancing issues from reaching its all time highs, along with England's FTSE advance/decline line moving into the apex of its symmetrical triangle configuration, the European theater seems to be looking forward toward better economic times as we go into the second half of this year. Interest rate sensitive products continue to be under pressure, however, with the expectation of higher rates continuing to be good news for both the Financial and NYSE REIT advance/decline lines as both finished the week at new all time highs.
So with this week's BETS continuing to rebound from its February 26th lows to a reading of +75, a renewed buy signal was issued for both traders and investors. This pretty much changes our expected blueprint for the second half of March from that of a correctional phase into a more bullish one as we move into the month of April. We'll note that the NYSE Composite and NASDAQ breadth McClellan Oscillators both had small point changes on Friday, so let's expect a dramatic move in the major market averages in the next two trading sessions to start the week ahead. Being that that we have quarterly, quadruple OPEX coming at the end of the week, along with many of the MCO's moving up and through their respective zero lines with little in the way of back and fill texture, the technical expectation will likely see prices moving lower overall in what will be snapback efforts to or toward any price breakouts that were made at the end of last week. With the NYSE Open 10 TRIN remaining at "oversold" levels (1.11) in spite of last weeks advance, this will also help to buoy any price pullback that we may see in this same effort. So with all this as a backdrop, let's once again continue to walk the bullish path of least resistance for the week ahead, but this time using any pullbacks as buying opportunities for, what should be, a bullish market environment as we go into the end of the March and early April.
Have a great trading week!
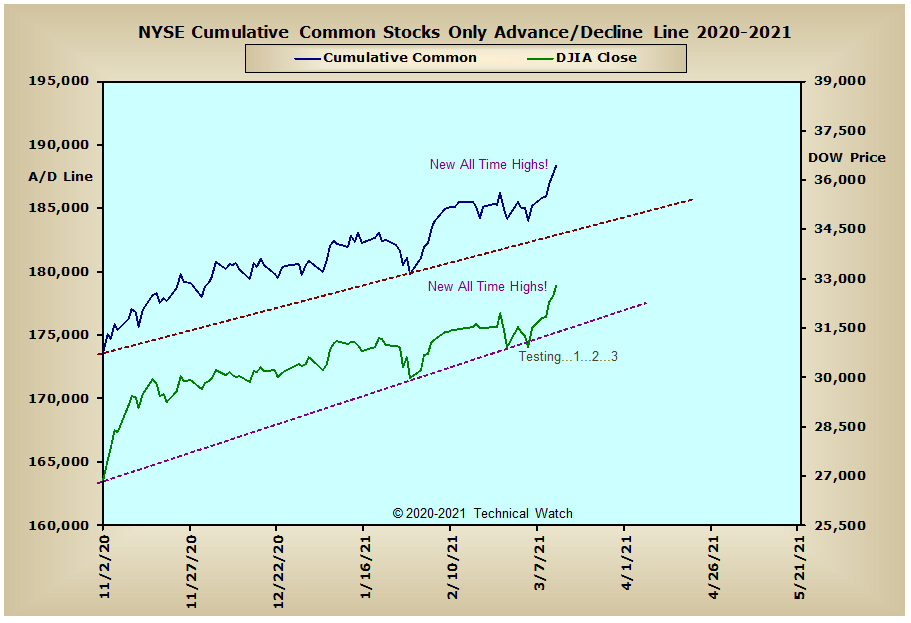
US Equity Markets: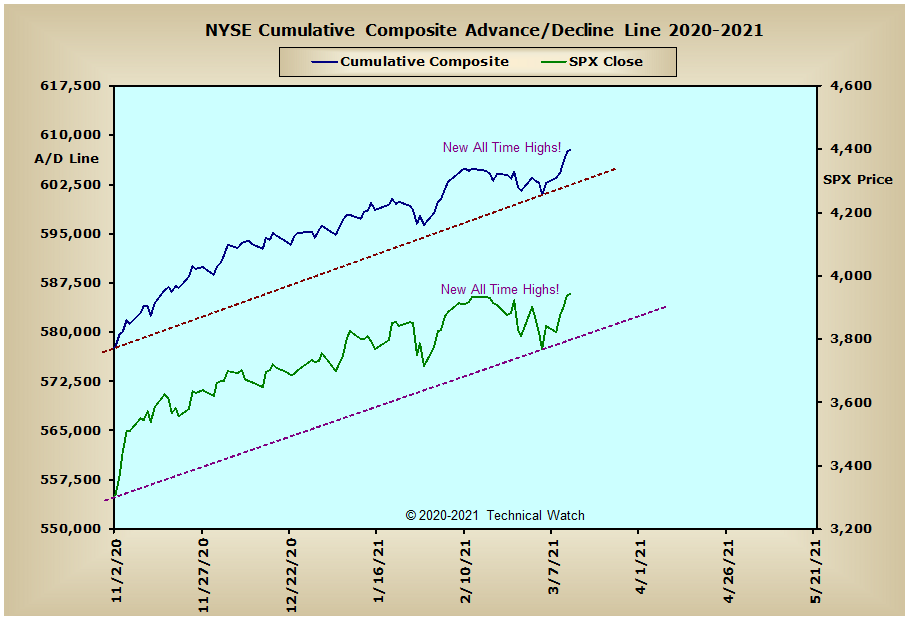
US Interest Rates: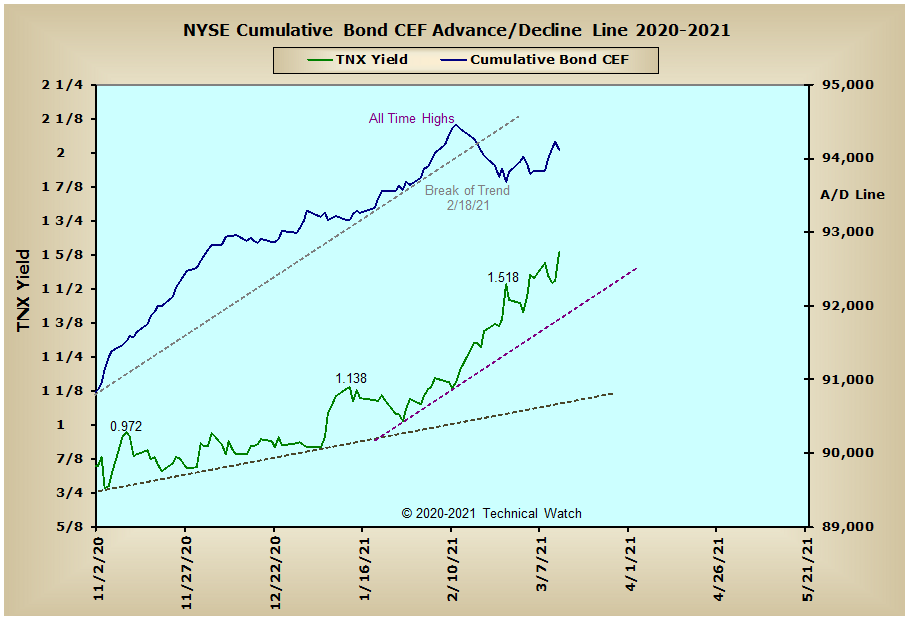

US Sectors:
Precious Metals: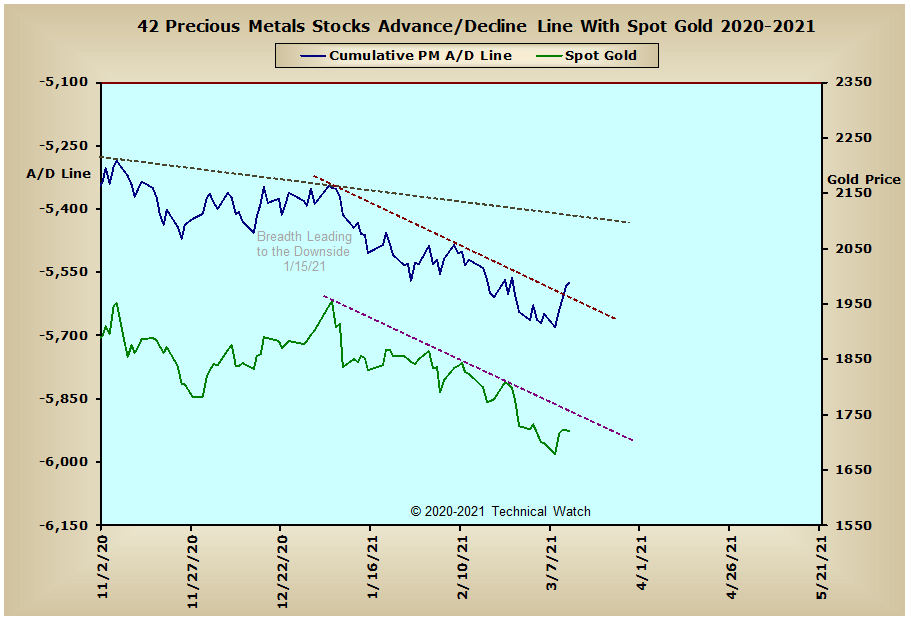
Australia:
England: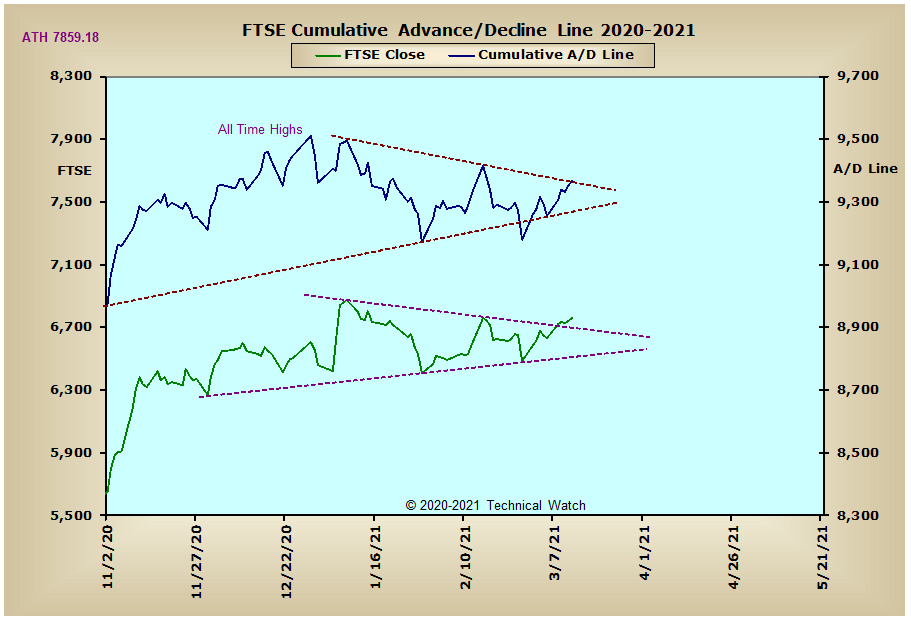
France:
Germany: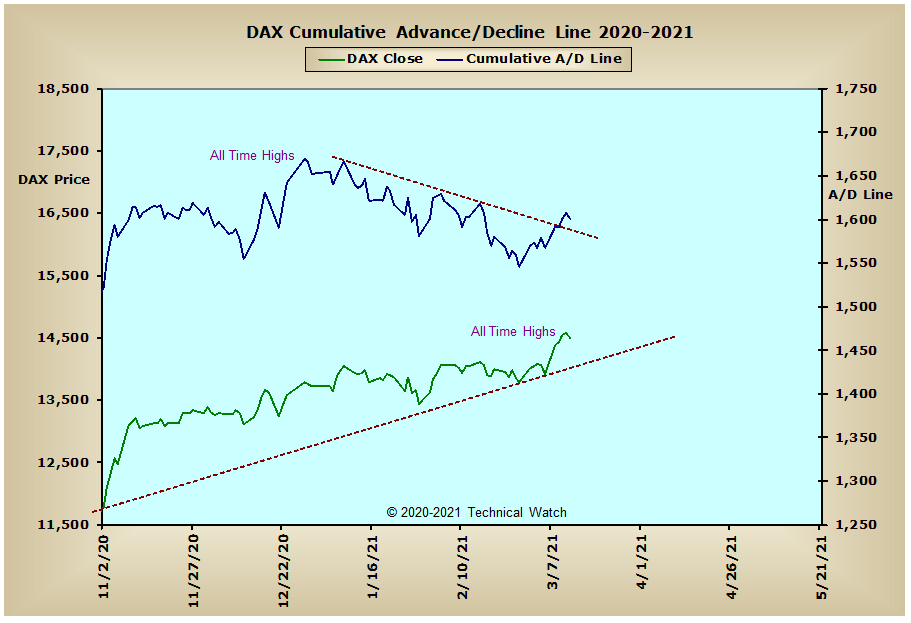
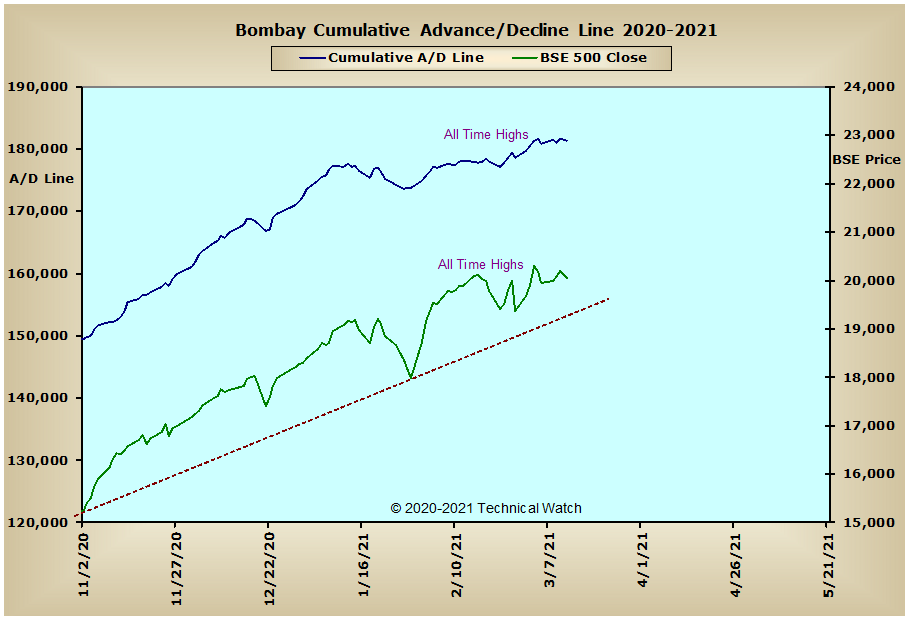
India: