Jump to content


Photo

Seasonally bullish, SPX 4400


  • Please log in to reply
102 replies to this topic

#1 dTraderB

dTraderB

    Member

  • Traders-Talk User
  • 17,305 posts

Posted 11 July 2021 - 09:40 PM

Good week, ended with a losing Friday. 

I lean towards this market forecast but think it will be difficult to move substantially above ES 4400


See link below:


Market Stumbles But Rallies Back

Last week, we discussed the market hit new highs with the index getting back to more extended and overbought conditions. To wit:


“The technical backdrop is not great. With the market back to 2-standard deviations above the 50-dma, conviction weak, and investors extremely bullish, the market remains set up for additional weakness.


However, we are in the first two weeks of July, which tends to be bullishly biased. After increasing our equity exposure previously, we will give the market the benefit of seasonality for now.”

While market volatility did pick up this past week, the index held its breakout support levels and closed at a new high. Such keeps the bullish bias intact. However, as shown, the money flow signals are now back to more elevated levels, which will provide resistance to higher prices short term.saupload_SP500-Chart-070921.png

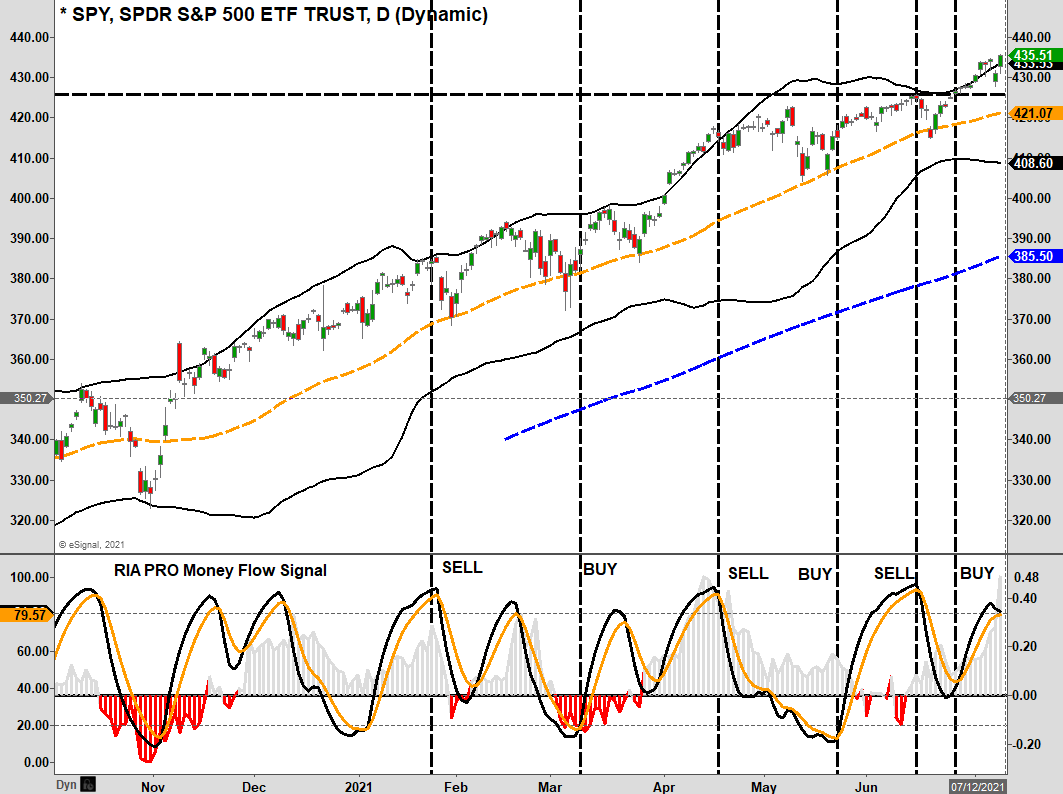
We are still within the seasonally strong period of July, which tends to last through mid-month. However, August and September are typically more challenging for returns. As we stated last week:

“The bulls are indeed in charge of the markets currently, but the clock is ticking.”

The market is also weak from a breadth perspective. While large-cap stocks have done better as of late, the rest of the markets have not.

The critical point is there has been a definite rotation out of the “reflation trade” (small, mid, emerging, and international markets) into the large-cap names (primarily technology),which is the “deflation trade.”

saupload_Reflation-Trade.png

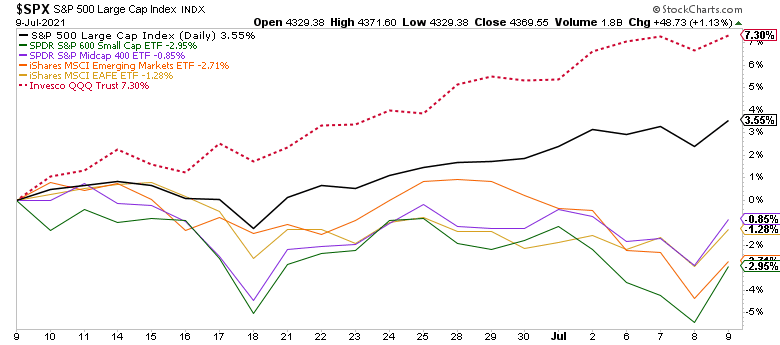
As we will discuss, the reflation trade ran well ahead of reality. Over the next couple of months, the test will be to see if earnings can support the surge in prices and valuations.

 
Yields Overbought

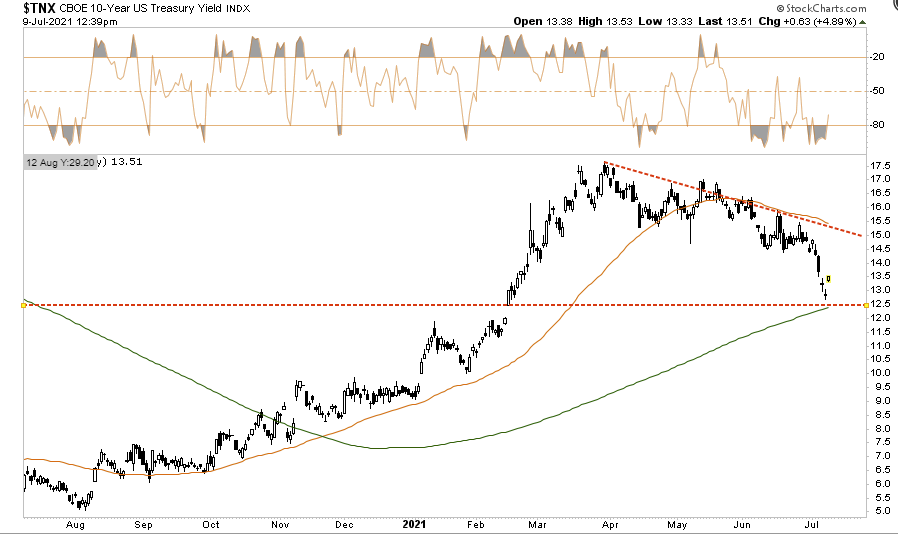
We will discuss the “yield warning” momentarily. However, in the short term, yields have gotten very overbought. We suspect we could see a retracement in yields short-term, but such will likely be an opportunity to increase bond exposure in portfolios as we head further into the year.

As shown, previous overbought conditions (indicators get inverted concerning yields) lead to retracements to resistance. Currently, a retracement to 1.5% would be likely. Ultimately, a break below 1.25% will suggest much lower yields are coming.

saupload_10-Year-Rate.png

From a positioning standpoint, we increased our bond duration several weeks ago. However, while we want to increase our exposure eventually, we need to wait for the short-term overbought condition to reverse.

Longer-term, as we will discuss next, we believe yields are potentially headed lower as economic growth and inflationary pressures wane.

https://seekingalpha...-trade-unravels


#2 dTraderB

dTraderB

    Member

  • Traders-Talk User
  • 17,305 posts

Posted 11 July 2021 - 09:42 PM

Did not check TIM last week:


TRIN readings above 1.30 show there is panic in the market and panic are what bottoms are made off. The 2, 3, 5 and 10 day average of the TRIN are near or at panic levels. Could be different this time but looks like a bottom is near. $SPX, $SPY


#3 dTraderB

dTraderB

    Member

  • Traders-Talk User
  • 17,305 posts

Posted 11 July 2021 - 09:44 PM

Still no sign of illiquidity problems from the high yield bond A-D data. These issues trade more like stocks than like T-Bonds, and they are ultra-sensitive to liquidity, both good and bad. [1/2]


"....The more interesting point right now is that the SP500 is acting much more like the 2nd term president plot, even though we have a first term president (Biden) from a different party than the last president (Trump).  That’s rather curious.  I am not just talking about the upward slope of the SP500’s price plot, but also the correlation to the minor structures in the 2nd term presidents’ plot.  If the market was going to follow the normal 1st term president plot, then we should have seen a top in May and a summer downturn, but we are not seeing that. 

Perhaps it is the Fed bending prices higher with QE4.  Perhaps it is a different style of campaigning for reforms that President Biden wants, a tone that does not bum out investors as much.  Whatever is the explanation, it is an interesting change in the normal first term behavior to take notice of. 

If the SP500 continues to follow the 2nd term Presidential Cycle Pattern, then a top lies just ahead, followed by the normal seasonal weakness into autumn.  And the 1st term PCP also shows a top just ahead, albeit more into early August than in mid-July, which is not a great distinction."

https://www.mcoscill...term_president/


#4 dTraderB

dTraderB

    Member

  • Traders-Talk User
  • 17,305 posts

Posted 11 July 2021 - 09:45 PM

Still below zero


McClellanOsc_1085.gif


https://www.mcoscill...t_breadth_data/


#5 dTraderB

dTraderB

    Member

  • Traders-Talk User
  • 17,305 posts

Posted 11 July 2021 - 09:46 PM

This buy every 1 day dip market is historic easy trading, but one con is it can condition new traders to lose view of what a healthy pullback really is & neglect risk management. $SPX can easily sell 12% to its 200dma at 3850 & it would be a routine trend pullback. Watch leverage
 
 
35
 
75
 
646


ZVBuToeP_normal.jpg
 
Have a great weekend! Next week, #ES_F should hit resistance a 1.5 year wedge - support of which halted every selloff this year Pullback likely at 4390-4408, but unless bears lose a support to trigger downside for once, this dip will setup a big break to 4700. Detail below. $SPX


#6 dTraderB

dTraderB

    Member

  • Traders-Talk User
  • 17,305 posts

Posted 11 July 2021 - 09:47 PM

Still bullish


Saturday Poll. The next 100 points for the S&P?
 
UP
55.9%
 
DOWN
44.1%
2,692 votes·Final results


#7 dTraderB

dTraderB

    Member

  • Traders-Talk User
  • 17,305 posts

Posted 11 July 2021 - 09:49 PM

".... as long as we hold the 4287SPX support level, the market will continue to rally. And, on Thursday, the market struck a low of 4289SPX, and then struck a new all-time high only one day later. Yes, my friends, this is a bull market, and it will continue to reach much higher levels over the coming two years.


For now, I will reiterate that I expect another buying opportunity in the stock market before we begin the next major rally over 4600SPX, potentially carrying us to 4900/5000SPX within the next 6 months. Therefore, I am still looking for a 200-300 point pullback over the coming months. But, as long as the market continues to hold the support levels we cite, that pullback may not begin until we reach the 4600SPX region. For now, that support is 4287-4300SPX, as we have raised it from my last publicly published article. And, we will continue to raise it as the market continues to subdivide higher.

The only question I have at this time is if the market will begin that 200-300 point pullback below 4440SPX, or if we can continue on towards 4600SPX before that pullback begins. The next two weeks of trading will provide us with that answer. As long as we hold the 4287-4300SPX support in the coming week or so, we will then attack the 4440-4490SPX region next, where we will again raise our support."


https://seekingalpha...rprises-to-come


#8 pdx5

pdx5

    I want return OF my money more than return ON my money

  • Traders-Talk User
  • 9,527 posts

Posted 12 July 2021 - 08:03 AM

download.png


Will this chart make a new high beating the 2000 record?

Looking quite possible!


"Money cannot consistently be made trading every day or every week during the year." ~ Jesse Livermore Trading Rule

#9 12SPX

12SPX

    Member

  • Traders-Talk User
  • 12,537 posts

Posted 12 July 2021 - 08:17 AM

Thanks d, always love all the reporting!!  Well it was a fun two days off last week.  Decided to actually relax and stayed out of the market.  The market continues its interesting ways which I think are very unhealthy until we can see real volatility remain and get at least another -2% correction.  At the open of trading I started my short build at 4361 and am still holding it instead of putting on a profit stop.  See how the day goes here after the cash open!! 


#10 12SPX

12SPX

    Member

  • Traders-Talk User
  • 12,537 posts

Posted 12 July 2021 - 08:19 AM

download.png


Will this chart make a new high beating the 2000 record?

Looking quite possible!

What is the reading on this chart, looks interesting....