https://www.siliconi...?msgid=33409094

incredible
Started by
da_cheif
, Jul 22 2021 08:07 PM
9 replies to this topic
#1

da_cheif
-
- Traders-Talk User
- 10,960 posts
Member
#2
RadioHead
-

- Traders-Talk User
- 192 posts
Member
Posted 22 July 2021 - 08:38 PM
I dont think I have ever seen this indicator so fearful while the market is at all time high. It is incredible.
#3
OEXCHAOS
-

- Admin
- 22,017 posts
Mark S. Young
Posted 23 July 2021 - 08:10 AM
That isn't the best timing tool and it's kind of a kludgy agglomeration of indicators. That said, the pessimism rose really quickly. The Relative VIX went to a Buy, for instance, almost immediately into the decline (and marked the low).
NAAIM median exposure fell pretty hard, but then, quite a few technical indicators went negative early this week. Cumulative AD volume looks like Hell, in fact. The ITBM is confirmed negative too as is BP. So, at least some market timers should be less exposed. AAII, however, shows a willingness to get Bearish fast. That's a Bullish sign no matter how you slice it.
Mark S Young
Wall Street Sentiment
Get a free trial here:
http://wallstreetsen...t.com/trial.htm
You can now follow me on twitter
#4
blustar
-

- Traders-Talk User
- 6,180 posts
blustar
Posted 23 July 2021 - 11:04 AM
I forecast on my timed blog and to my subs on early Tuesday 4406/08 SPX for today. My subs went long the end of the day Monday. I'm looking for a minor pull back into early Tuesday next week 30-40 SPX points from the top today. I'm looking for an eventual SPX top on Aug 4 and the beginning of a new bear.
#5
12SPX
-

- Traders-Talk User
- 12,477 posts
Member
Posted 23 July 2021 - 12:29 PM
I forecast on my timed blog and to my subs on early Tuesday 4406/08 SPX for today. My subs went long the end of the day Monday. I'm looking for a minor pull back into early Tuesday next week 30-40 SPX points from the top today. I'm looking for an eventual SPX top on Aug 4 and the beginning of a new bear.
That's great however if I could make a suggestion don't put up posts like this cause it makes you look really bad. "I'm calling THE top at least on a closing basis for Friday July 16, 2021. I could be off a day at most for a print top. I see as bad as crash as what happened in Feb/Mar 2020 in Jul/Aug 2021 ~ 35% down". You said it was going to be THE top and you waffled right away, maybe go with "I'm calling a forming top starting some where around July 16, 2021 to August 3 2056!!! LOL!!! Sorry for jabbing ya just kidding lol!! 
#6
andr99
-

- Traders-Talk User
- 7,431 posts
Member
Posted 23 July 2021 - 12:33 PM
I forecast on my timed blog and to my subs on early Tuesday 4406/08 SPX for today. My subs went long the end of the day Monday. I'm looking for a minor pull back into early Tuesday next week 30-40 SPX points from the top today. I'm looking for an eventual SPX top on Aug 4 and the beginning of a new bear.
sorry, but what does it mean ''a new bear'' ? which was the previous one, because recently I saw none......they seem to go on with their consolidated tactics......a little drop of two days and then up again.......direction....the moon..........watch the sky....someone would say
forever and only a V-E-N-E-T-K-E-N - langbard
#7
tsharp
-

- Traders-Talk User
- 1,487 posts
Member
Posted 23 July 2021 - 01:05 PM
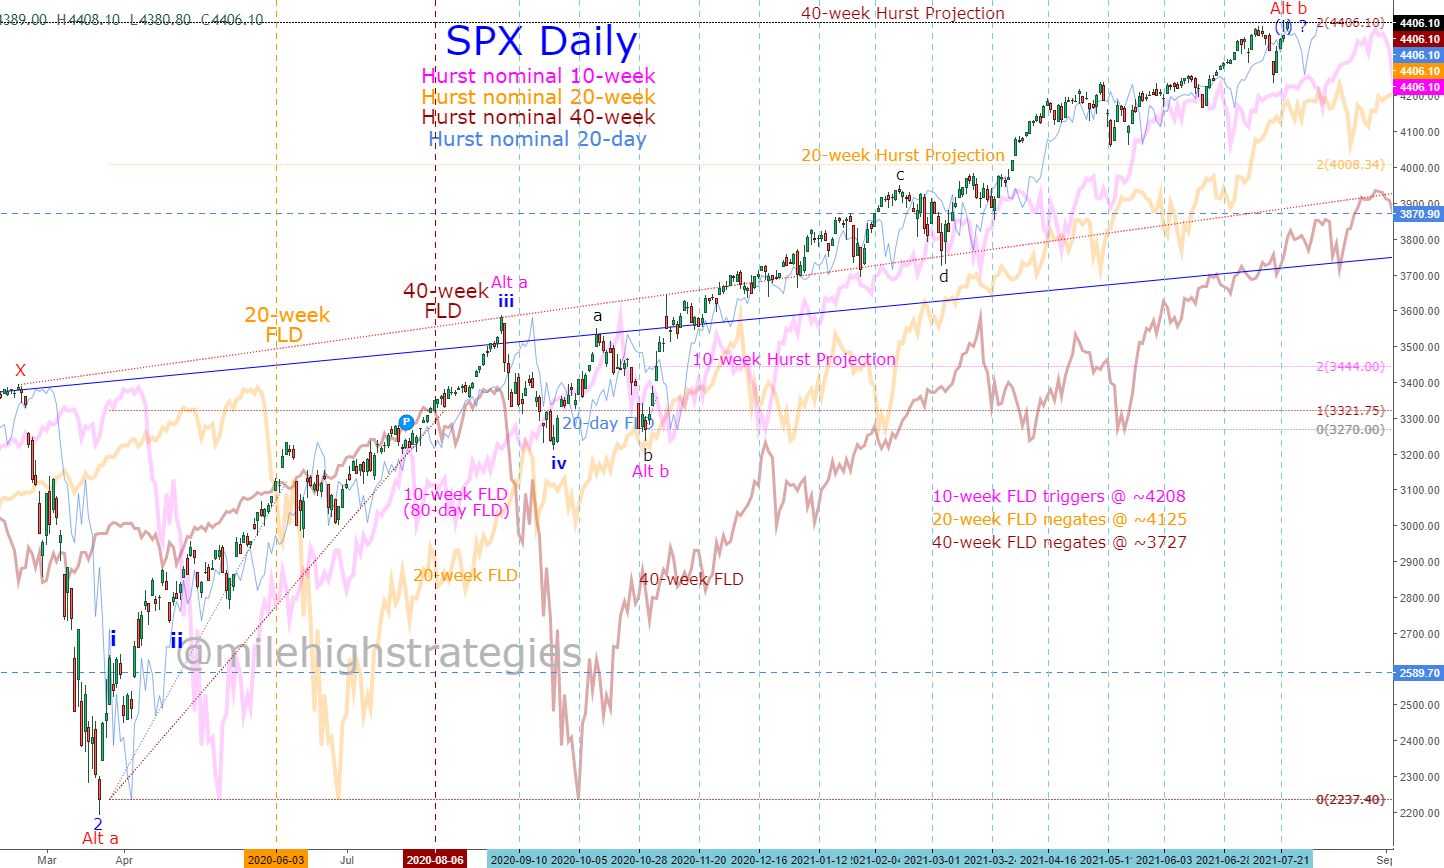
AUGUST 2020 FORECAST TARGET HIT
Welp, it sure took it's sweet time in getting there, but my upward target of SPX ~4406.1 from August 6, 2020 was finally hit today on an intraday basis, though this target is for a closing basis, so let's see if the bools can hold it into the close... watching
#8
GDA
-

- Traders-Talk User
- 116 posts
Member
Posted 23 July 2021 - 03:34 PM
"I'm calling THE top at least on a closing basis for Friday July 16, 2021
Expecting ortho top on the 26th and perhaps irr top on the 29th of July then 41-42% bear into Oct 20th. We are ending Benner's Cycle 2018-22, 34 fib years ago was 1987 which was another ending of Benner's Cycle.. The SUN in Leo activates the Saturn/Uranus square August 2-6. August is the kick off down about 20% into August 24.
Now expecting ortho top on the 29th of July above 4414 and an irr. top on the ndx and spx on AUG 4 (Min High 4424/25, Max high 4469).. A VST top should occur on the 23rd and a VST low on the 27th. This should be the last top before a 41-42% bear market into Oct 24 ~. to about 2600 SPX Monday was a shot across the bow, IMO.
Aug 2-6 The Sun in Leo forms a T. to the Saturn/Uranus 2nd square formed on June 14. Last week we had Venus/Mars conj. in Leo on the 13th as the moon was also in Leo leading to the wave z decline [this is an xyz bull flag]."
Keep calling for a top every week and you may get one, eventually.
#9
tsharp
-
- Traders-Talk User
- 1,487 posts
Member
Posted 23 July 2021 - 04:15 PM
AUGUST 2020 FORECAST TARGET HIT
Welp, it sure took it's sweet time in getting there, but my upward target of SPX ~4406.1 from August 6, 2020 was finally hit today on an intraday basis, though this target is for a closing basis, so let's see if the bools can hold it into the close... watching
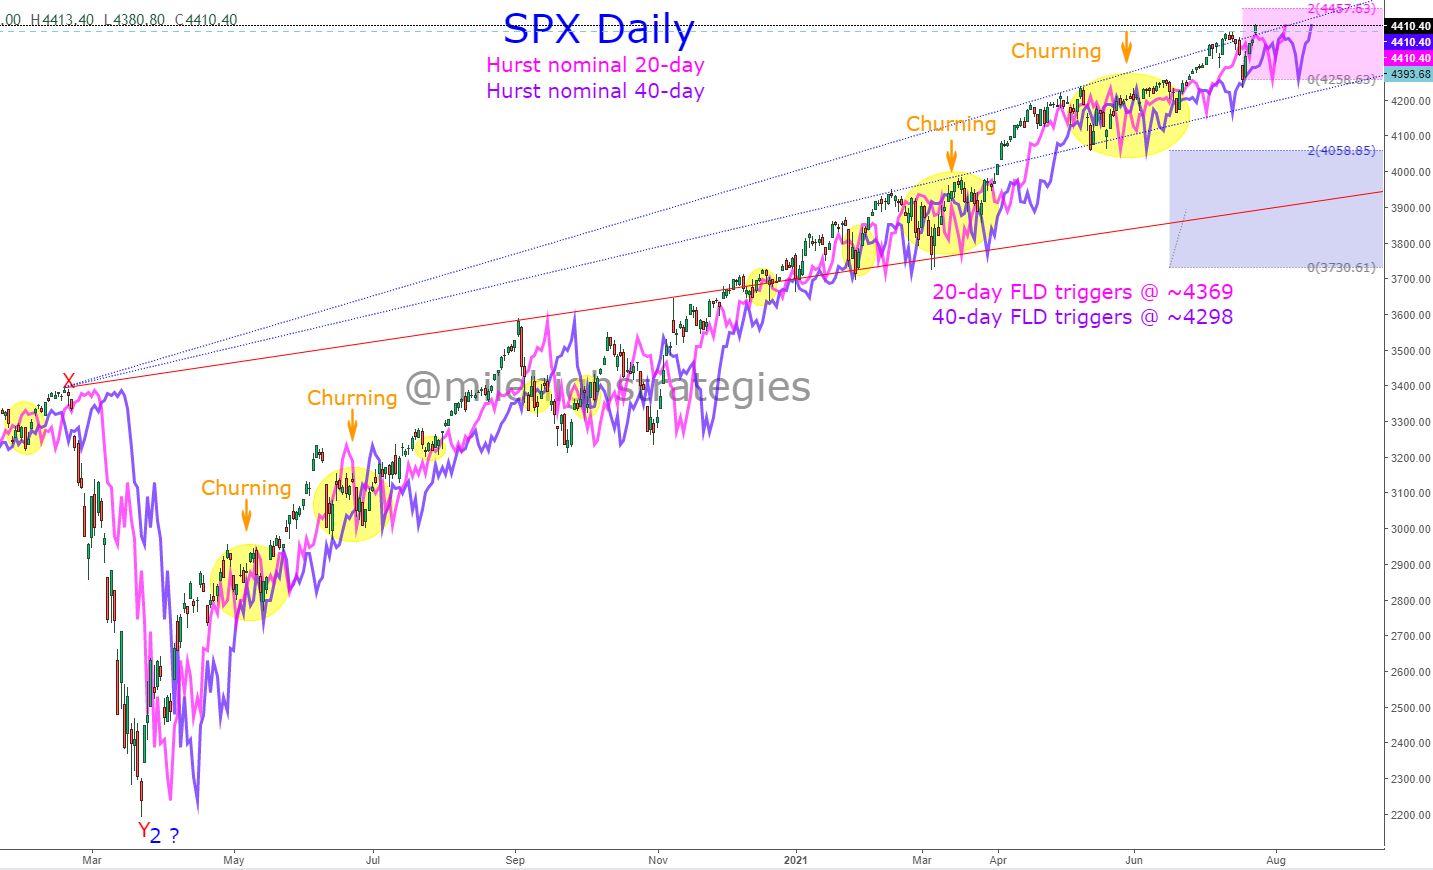
SPX DAILY HURST PROJECTIONS UPDATE
The SPX closed above my August 2020 forecast of ~4406.1, so that's finally a fulfilled target, though the #Hurst nominal 20-day FLD generated a new target a couple days ago of ~4458, so for now, that is the only other projection for the 20-day, 40-day, 10-week, 20-week and 40-week projections... watching
#10
da_cheif
-
- Traders-Talk User
- 10,960 posts
Member
Posted 24 July 2021 - 11:47 AM
That isn't the best timing tool and it's kind of a kludgy agglomeration of indicators. That said, the pessimism rose really quickly. The Relative VIX went to a Buy, for instance, almost immediately into the decline (and marked the low).
NAAIM median exposure fell pretty hard, but then, quite a few technical indicators went negative early this week. Cumulative AD volume looks like Hell, in fact. The ITBM is confirmed negative too as is BP. So, at least some market timers should be less exposed. AAII, however, shows a willingness to get Bearish fast. That's a Bullish sign no matter how you slice it.
cumulative ad volume .......since the 30 dow components make up the bulk of the nyse volume......or a big percentage of it.......dont let the cumulative volume bother u.....the higher the volume of the dow components....btw monday everyone of the 30 was down ....the more bullish it is.....if you noticed going into the 09 low volume grew exponentially and obviously was very bullish


