Jump to content


Photo

DELTA doubts in seasonally weak August


  • Please log in to reply
32 replies to this topic

#1 dTraderB

dTraderB

    Member

  • Traders-Talk User
  • 17,167 posts

Posted 08 August 2021 - 07:02 PM

But it is a strong rally and there is always the exception to normal seasonal trends. 
 

Have a great weekend! After a successful 50dma test on July 19, #ES_F is well into its next leg Plan next week- target is obvious: Resistance of a multiyear wedge at 4480. Pullback there. Bears need to lose 4400 support though or this simply continues to 4600. Details below $SPX
 
ZVBuToeP_normal.jpg
 
Have a great weekend! After a successful 50dma test on July 19, #ES_F is well into its next leg Plan next week- target is obvious: Resistance of a multiyear wedge at 4480. Pullback there. Bears need to lose 4400 support though or this simply continues to 4600. Details below $SPX


#2 dTraderB

dTraderB

    Member

  • Traders-Talk User
  • 17,167 posts

Posted 08 August 2021 - 07:04 PM

Great first week of August, will be risk-off for most of the rest of August unless markets make new ATHs


Saturday Poll The next 100 points for the S&P?
 
UP
53.5%
 
DOWN
46.5%
2,574 votes·Final results


Saturday Poll The next 100 points for the S&P?
 
UP
53.5%
 
DOWN
46.5%
2,574 votes·Final results


#3 dTraderB

dTraderB

    Member

  • Traders-Talk User
  • 17,167 posts

Posted 08 August 2021 - 07:06 PM

I am scalping short NAT GAS, good profits so far, and I want to hold a few SHORTS into SEPTEMBER


Holding 9 and will add more if traded above 4.18 


This is weird, and thus fun. Technicians look to the COT Report data to see when classes of traders are leaning too far one way or the other. Commercials are the smart money. Normally they move with prices. But Comm. natgas traders are going more net long, despite price rally.


#4 dTraderB

dTraderB

    Member

  • Traders-Talk User
  • 17,167 posts

Posted 08 August 2021 - 07:08 PM

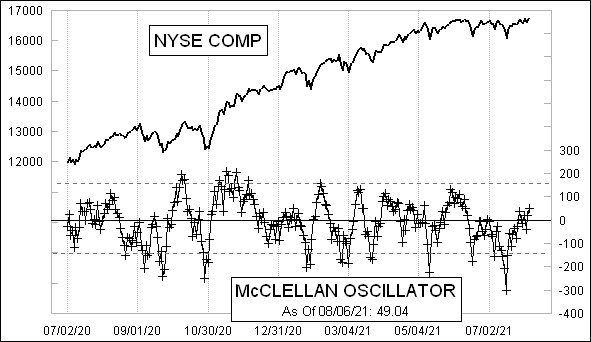
Heading towards 200


McClellanOsc_1105.gif


https://www.mcoscill...t_breadth_data/


#5 dTraderB

dTraderB

    Member

  • Traders-Talk User
  • 17,167 posts

Posted 08 August 2021 - 07:16 PM

That ES 4450 level is strong resistance


A bee line towards 4404, down 20 points right at opening bell Powered by Orderflow while other furu adjusting which SMA setting to use this week
 

Weekly scenarios + levels 8/8:

1. Expect a rapid dip into 4399.75-4404 before a move higher into 4456-4470

2. At 4456-4470, failure could occur, leading to softness development & downside trade of 4308

3. Upon a D1 close < 4399.75, I expect 4308 soon thereafter

4. Now 4430.50


#6 dTraderB

dTraderB

    Member

  • Traders-Talk User
  • 17,167 posts

Posted 08 August 2021 - 07:20 PM

Above ES 4450 is lower risk shorting. So these are the 3 main LEVELS "experts" I follow.  These levels are not trade triggers but I compare to my analysis and look for similarities or big differences


Weekly plan for $SPX: First (minor) support at 4416-4420. Below that stronger support at 4400-4403. Bias is bearish below & next is 4372 & then 4325-4330. First resistance at 4457-4463. Above that (if happens), very strong resistance at 4484-4488.


#7 dTraderB

dTraderB

    Member

  • Traders-Talk User
  • 17,167 posts

Posted 08 August 2021 - 07:24 PM


T3AL_IqJ_normal.jpg
 
The trailing 12-month P/E ratio for $SPX of 31.4 is above the 5-year average (22.5) and above the 10-year average (19.4). https://bit.ly/3AwKiCn
·
43m
 
The trailing 12-month P/E ratio for $SPX of 31.4 is above the 5-year average (22.5) and above the 10-year average (19.4). https://bit.ly/3AwKiCn


T3AL_IqJ_normal.jpg
 
The trailing 12-month P/E ratio for $SPX of 31.4 is above the 5-year average (22.5) and above the 10-year average (19.4). https://bit.ly/3AwKiCn

Edited by dTraderB, 08 August 2021 - 07:25 PM.


#8 dTraderB

dTraderB

    Member

  • Traders-Talk User
  • 17,167 posts

Posted 08 August 2021 - 07:27 PM

This will end badly for many.... hope it does not but history's lessons must be heeded or else...


Thinking about buying $HOOD options? Here's a quick look at what options are and how investors can use them from


Bitcoin rallied as high as $44,575 early Sunday — almost hitting its 200-day moving average of $44,600 — before slipping.


#9 dTraderB

dTraderB

    Member

  • Traders-Talk User
  • 17,167 posts

Posted 08 August 2021 - 07:30 PM

"Weirdness" is the word MarketWatch used to describe it:


Earnings Watch: Meme stocks, fresh IPOs and SPACs, electric-vehicle companies and more will reveal earnings likely at odds with their outsize valuations in the week ahead.


#10 dTraderB

dTraderB

    Member

  • Traders-Talk User
  • 17,167 posts

Posted 08 August 2021 - 07:31 PM

Mark Hulbert a bit bearish:


Mark Hulbert Opinion: Here’s another sign the bull market is near a peak, and this one bears watching


Last Updated: Aug. 7, 2021 at 8:24 a.m. ET First Published: Aug. 6, 2021 at 7:23 a.m. ET
S&P 500 sectors’ relative strength rankings are flashing red

https://www.marketwa...ewsviewer_click