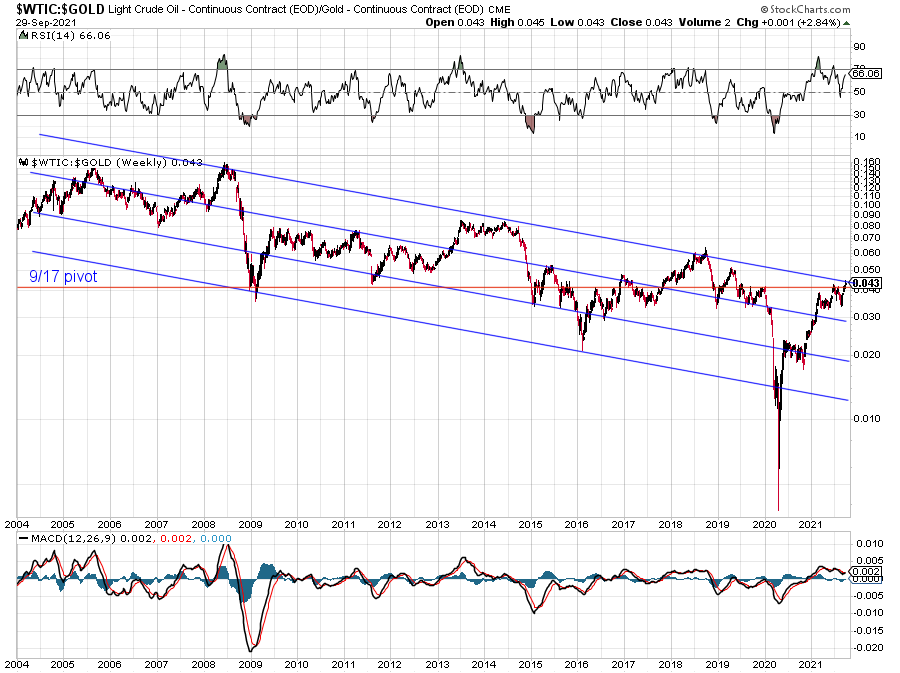
oil has yet to break out - appears tp be butting up against strong resistance.

If oil does break out, the move could be quite strong, resulting in much pain at the gas pumps. Hopefully it will crash instead - for the sake of the bottom 90%.

Member
Posted 30 September 2021 - 10:31 AM
oil has yet to break out - appears tp be butting up against strong resistance.
If oil does break out, the move could be quite strong, resulting in much pain at the gas pumps. Hopefully it will crash instead - for the sake of the bottom 90%.
Member

Posted 30 September 2021 - 11:58 AM
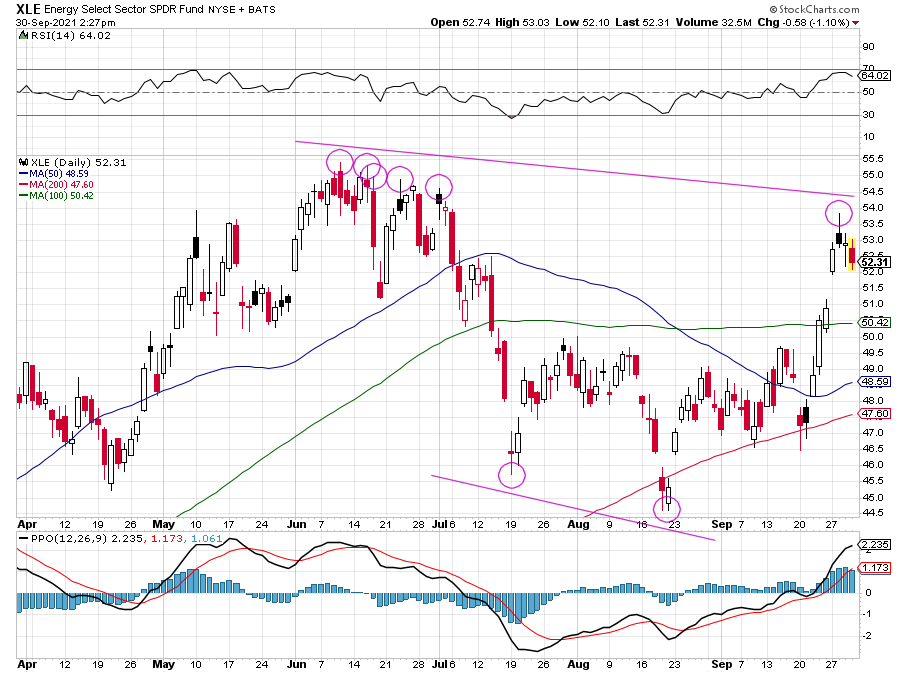
i would disagree with you on that one . i have oil in a wave 3 up look at the xle and the oil
stocks acting just fine imho i believe they are all going a lot higher xle ito at least 75 perhaps
higher
Member

Member
Posted 30 September 2021 - 02:56 PM
I wasn't making a forecast - so I guess my post really doesn't belong on this forum. I was just responding to gm's earlier post suggesting that the breakout had already occurred, and I was wondering at what level that took place. Everything I look at seems to point to the markets being at a critical juncture, so being wrong about the direction of the next move could be costly.
On the daily chart I see lower highs and lower lows with the RSI coming off a high.
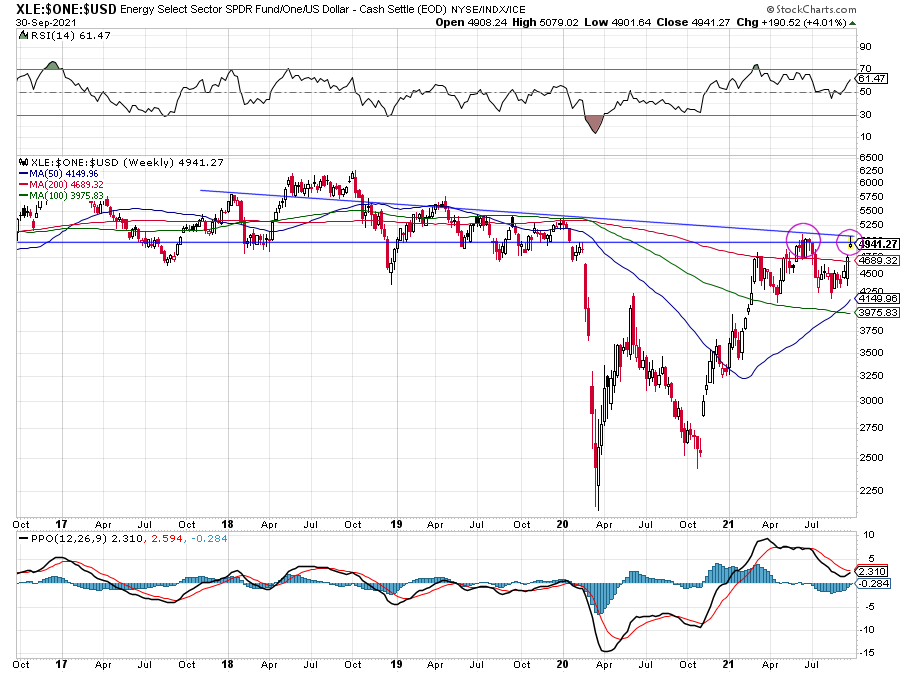
On the five year fiat chart I see what appears to be a failed breakout attempt in June with possibly a second failure occurring now.
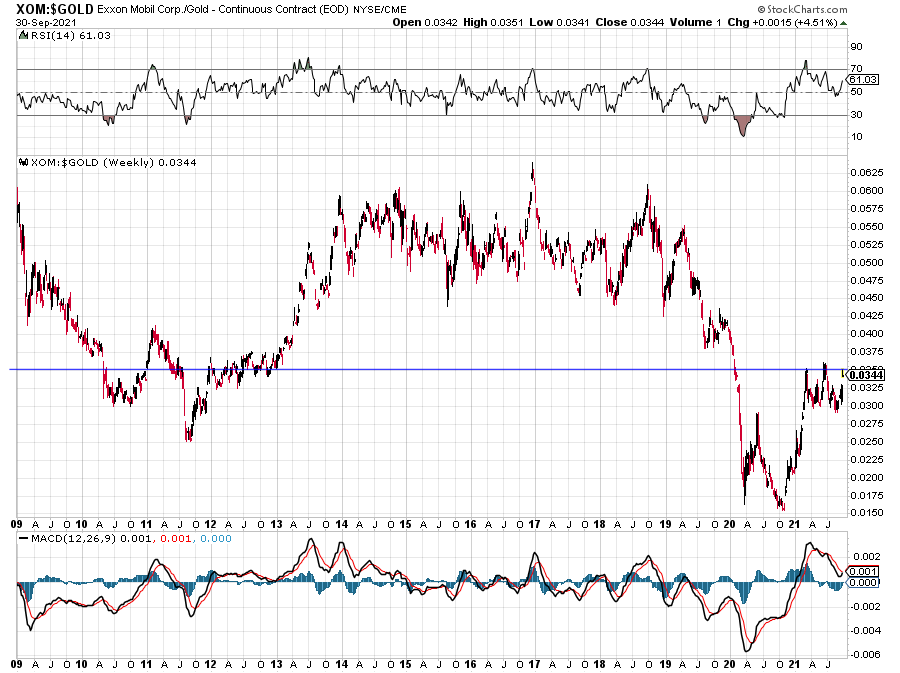
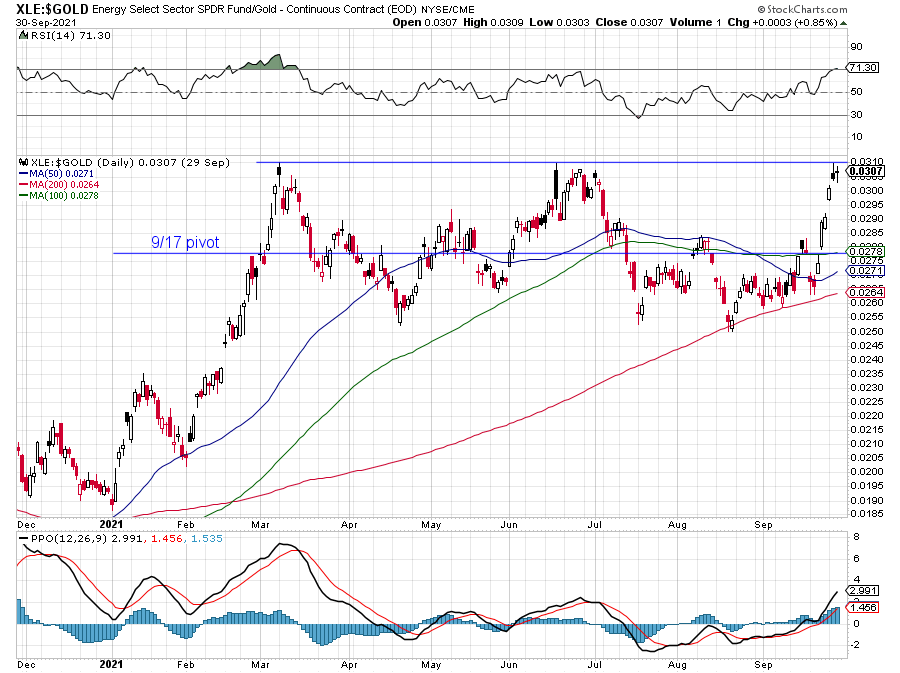
On the daily gold chart I see a perfect triple top.
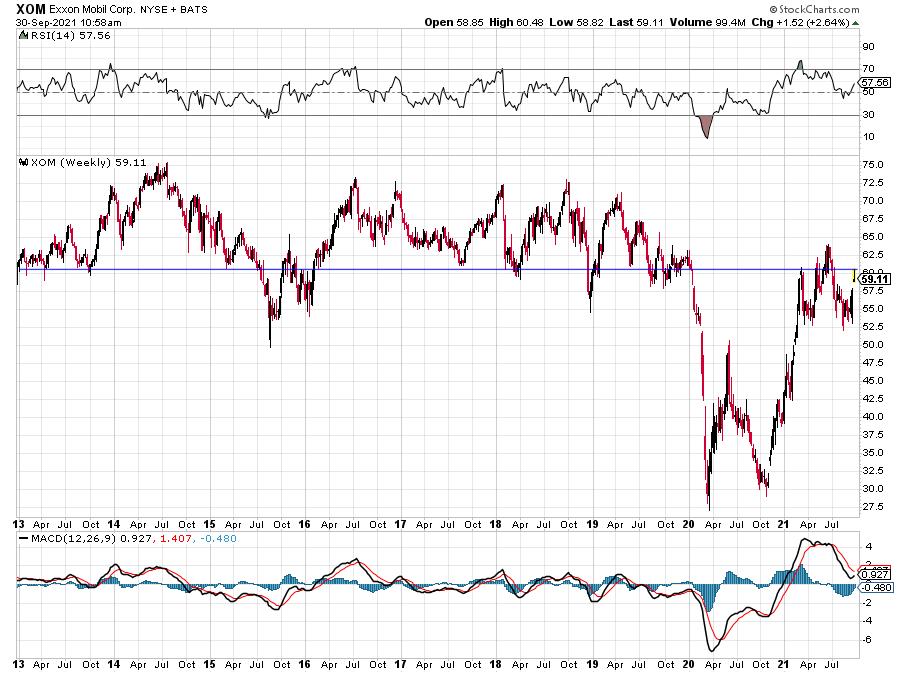
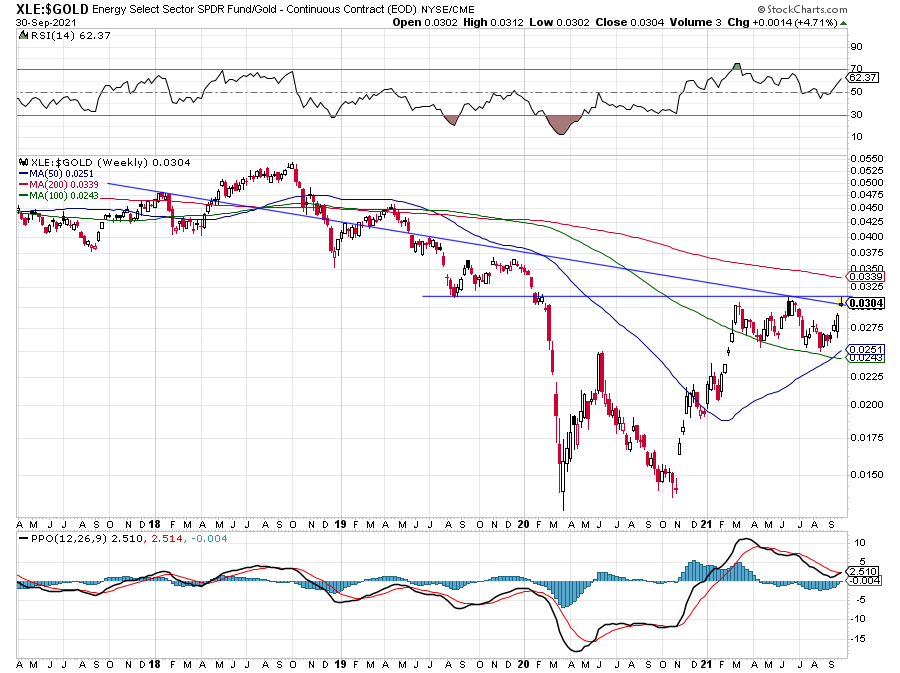
On the weekly gold chart I see a double-top test of an important resistance level.
If oil does break higher from here I cringe at the thought of the inflationary pressures that would follow.


