"High point for this cycle"
Last Thursday the S&P 500 (SPX) closed at an all time high and last Friday the NASDAQ composite (OTC) closed at an all time high.
There were no confirmations of last week’s all time highs by any of the breadth indicators.
"Decision Point Charts" on SPX
"Short-Term Oscillators": have turned down and are below zero
"Intermediate-Term Oscillators": Breadth and Volume Momentum Oscillators are positive but have crossed down
"McClellan Oscillators": are positive but have turned down
The previous week's AAII bulls were at their highest since since late June but dropped a bit last week.
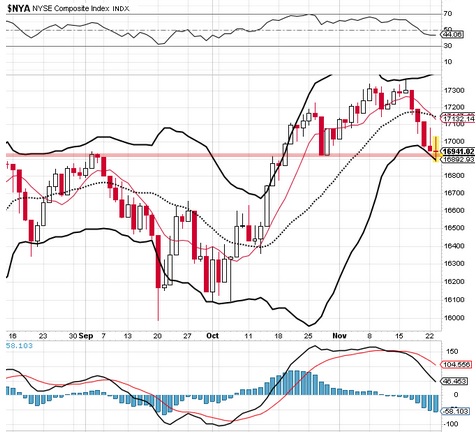
The NYSE and INDU are both below their Oct 30th price!
(When I posted caution on the "meaningless" CNN Fear and Greed index.)
Rogerdodger, 30 Oct 2021
Then there's the Monthly NYSE 7 Year Cycle chart looking as toppy as it has at it's previous 3 tops
But if massive amounts of free money keep flowing, "Don't fight the FED!"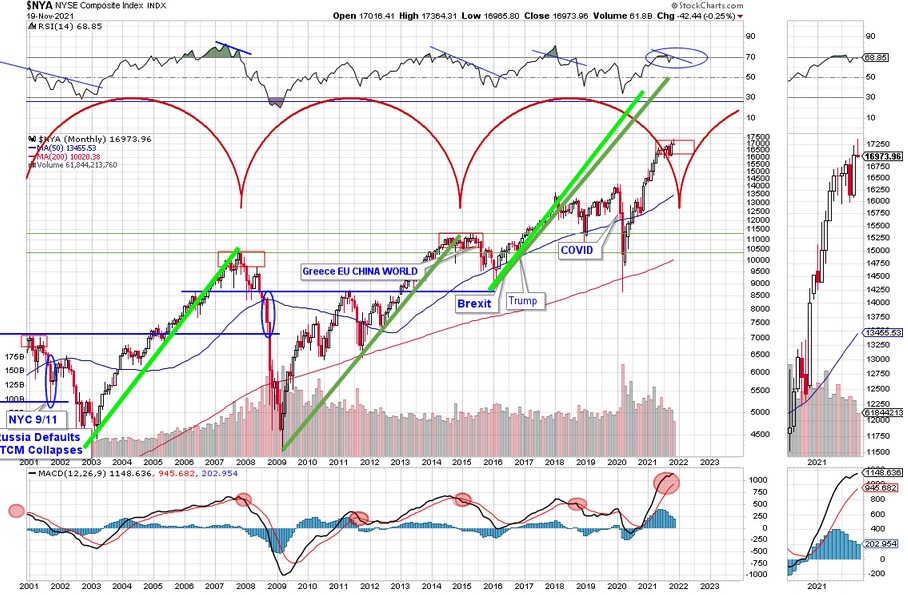
Edited by Rogerdodger, 21 November 2021 - 01:25 PM.