AAII is showing 23.10% Bullish and 52.90% Bears. This is a bit more Bullish and a lot more Bearish. This is a ST Buy and an IT Buy. Last week they had 21.00% Bullish and 46.70% Bears.

AAII Even More Beared-Up
Started by
OEXCHAOS
, Jan 27 2022 10:02 AM
20 replies to this topic
#1

OEXCHAOS
-
- Admin
- 22,015 posts
Mark S. Young
Posted 27 January 2022 - 10:02 AM
Mark S Young
Wall Street Sentiment
Get a free trial here:
http://wallstreetsen...t.com/trial.htm
You can now follow me on twitter
#2
K Wave
-

- Traders-Talk User
- 26,639 posts
Member
Posted 27 January 2022 - 10:52 AM
Until the charts actually right themselves, could be meaningless.
If we make it past AAPL tonight without tanking, then could be real meaningful....
The strength of Government lies in the people's ignorance, and the Government knows this, and will therefore always oppose true enlightenment. - Leo Tolstoy
#3
q4wer
-

- Traders-Talk User
- 2,177 posts
Member
Posted 27 January 2022 - 01:45 PM
APPLE may create a bounce tomorrow.
#4
beta
-

- TT Patron+
- 4,089 posts
lasergirl
Posted 27 January 2022 - 01:54 PM
Do these indicators work in a bear market? Seems like the last 12 years has culled all but the most lean and mean bears.
Surviving bears are not dumb money. Conversely, the past decade has cultivated LOTS of dumb money bullz. 
Anyways, I do think we get a decent rally soon -- i.e., from SPX 4000/ AAPL 140's.
"Daytrading -- An Extreme Sport !"
#5
fib_1618
-

- Traders-Talk User
- 10,145 posts
Member
Posted 27 January 2022 - 01:54 PM
Provided with all due respect to Mark and Don...with no malice toward sentiment analysis or axe to grind...but as a comparable period to the current internal market action.
For more on "Trend Divergence" you can refer to the Market Analysis area of this site where I've been recently sharing the Weekly Breadth Data reviews.
Fib

Edited by fib_1618, 27 January 2022 - 02:31 PM.
Better to ignore me than abhor me.
“Wise men don't need advice. Fools won't take it” - Benjamin Franklin
"Beware of false knowledge; it is more dangerous than ignorance" - George Bernard Shaw
Demagogue: A leader who makes use of popular prejudices, false claims and promises in order to gain power.
Technical Watch Subscriptions
#6
kaiser soze
-

- Traders-Talk User
- 884 posts
Member
Posted 27 January 2022 - 02:55 PM
We are at SPX 4320 on Thu afternoon at 3 pm EST as I type this. In a "normal market", ST bottom is probably in place at SPX 4223 on Monday due to extreme oversold breadth readings.
According to the tables I keep, out of 1955 technology + biotech stocks (i.e. high growth sector) across all US exchanges, only 8% of issues are over their 50 day moving averages as of Thu afternoon, only 11% of issues are above their 200 day moving averages, and only 13% of these issues have a PNF buy signal. We really need a bounce here if we are to avoid an all-out crash.
#7
hhh
-

- Traders-Talk User
- 1,062 posts
Member
Posted 27 January 2022 - 03:04 PM
Short term charts here are looking somewhat constructive for a bottom here: https://stockcharts..../dpgallery.html
#8
Rogerdodger
-

- TT Member*
-

- 26,870 posts
Member
Posted 27 January 2022 - 04:18 PM
Sentiment is just one of many indicators.
Don't leave home without it!

But just in case...Assume crash position!
Edited by Rogerdodger, 27 January 2022 - 04:25 PM.
"Nature's Failure to Function in a 'Predictable Way'... 500 years ago?"
BIGGEST SCIENCE SCANDAL EVER...Official records systematically 'adjusted'.
BIGGEST SCIENCE SCANDAL EVER...Official records systematically 'adjusted'.
#9
steadyquest
-

- Traders-Talk User
- 775 posts
Member
Posted 27 January 2022 - 04:21 PM
Playing around with the number 3.5 (during dot com bust)
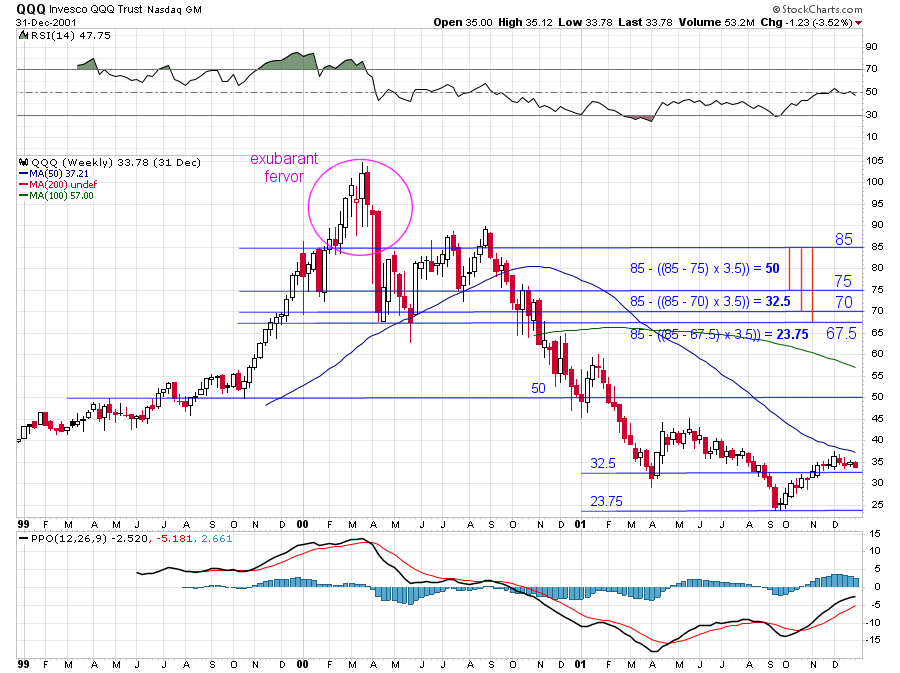
A fanciful extrapolation

#10
Rogerdodger
-
- TT Member*
-
- 26,870 posts
Member
Posted 27 January 2022 - 05:04 PM
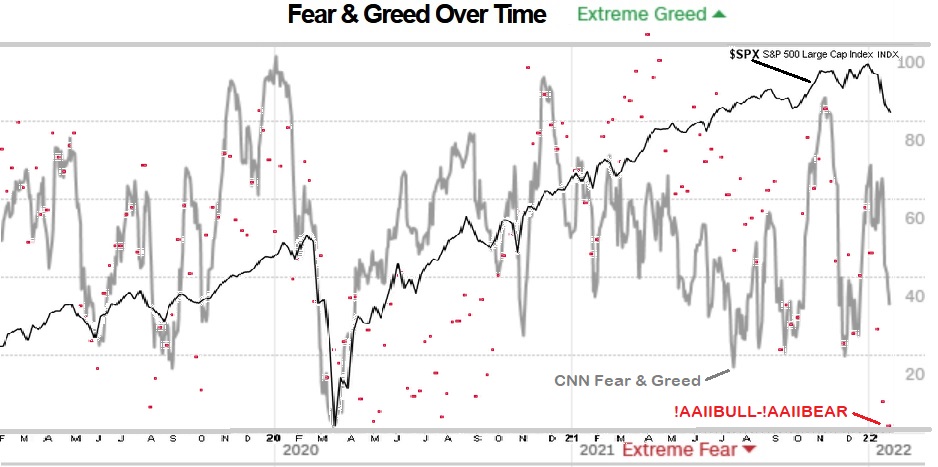
I find it interesting to compare a "sentiment" poll with CNN's fear and greed index (33 at today's close) which is based on technical market indicators.
There is often quite a difference in the two.
"Nature's Failure to Function in a 'Predictable Way'... 500 years ago?"
BIGGEST SCIENCE SCANDAL EVER...Official records systematically 'adjusted'.
BIGGEST SCIENCE SCANDAL EVER...Official records systematically 'adjusted'.


