
Last week saw the equity markets digest the gains they had made just the week before as the major market indexes finished slightly higher on Friday with an average gain of +.80%, with the NASDAQ Composite Index pacing the week with a gain of +1.98%, while the S&P 600 Small Cap Index saw a loss of -.58%.
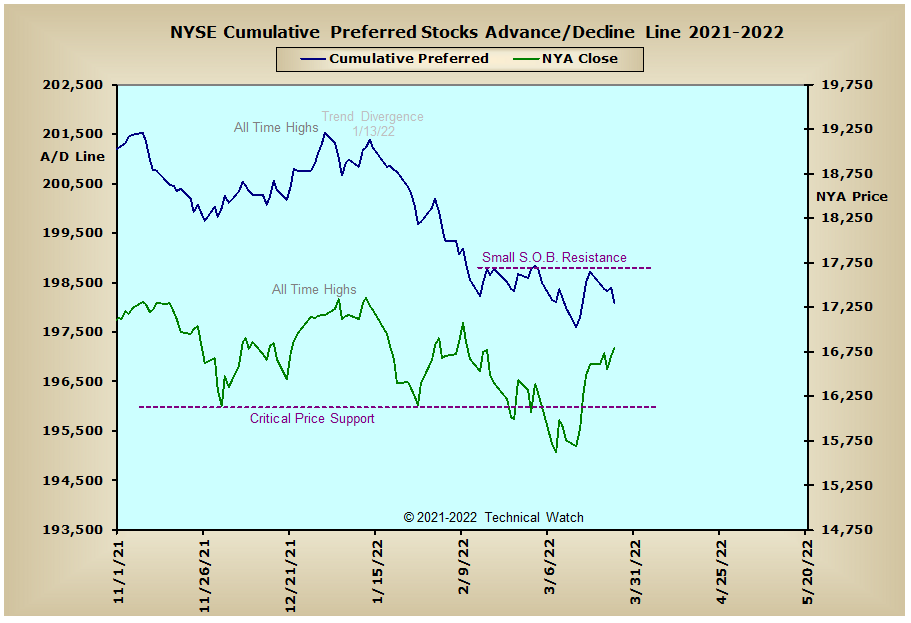
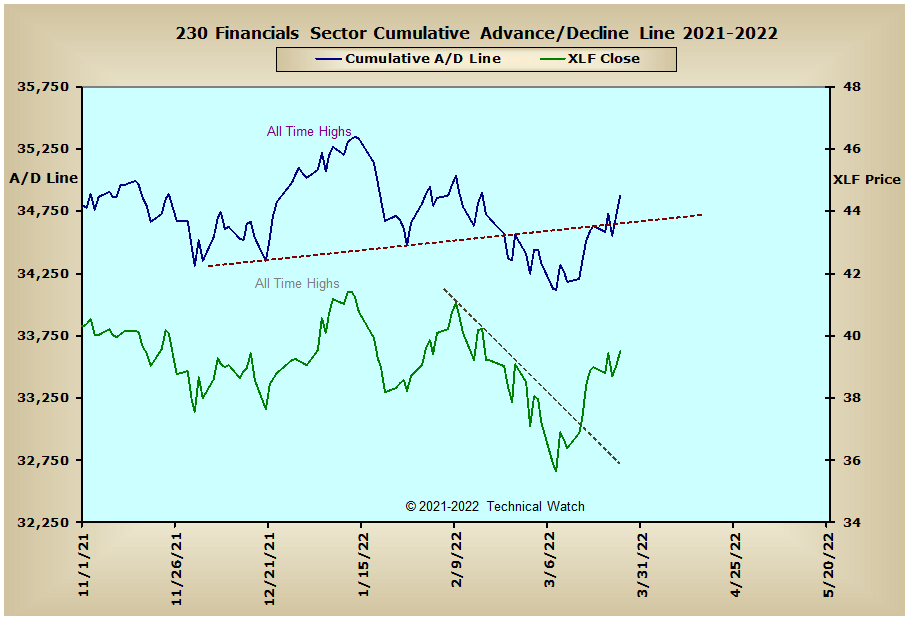
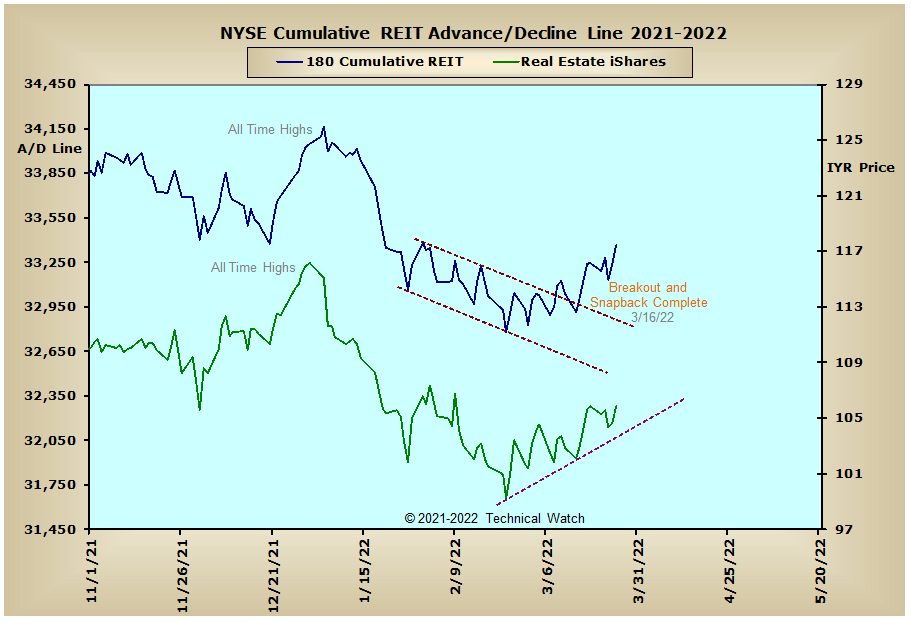
Looking over our usual array of cumulative breadth charts for this week and we see that the interest rate sensitive issues that trade on the New York Stock Exchange continue to move sharply lower as the yield on the 10 year note gained 1/4 point (16%) to just under 2.50%. This, in turn, has continued to put a cap on the NYSE Composite advance/decline line which is currently trying to negotiate its way above its S.O.B. trigger line that was broken back on February 22nd. S.O.B. pattern resistance was also seen in the NYSE Preferred Stock advance/decline line as well, and this is now providing bearish divergence against the broader based New York Composite Index. The Energy Sector advance/decline line remains strong as the XLE finished on Friday at new all time highs. In other areas, the Financial Sector advance/decline line is also showing new vigor with the anticipation of still higher interest rates to come to help increase their profit margins, while the NYSE REIT advance/decline line swung to new recovery highs in anticipation of buyers getting off their indecision to secure lower costs in buying any and all real estate before these same costs of borrowing move out of range to do so. The trends in both the Precious Metals and XAU advance/decline lines continue to move higher and this should translate to still higher prices to come for the price of both gold and silver as the fear of even higher inflationary numbers remains on traders and investors minds. International markets are now on the mixed side as the Aussie, CAC, DAX, FTSE and Bombay advance/decline lines all continue to trail their recent price recoveries.
So with the BETS climbing again to a reading of +15, investors remain on the sidelines while traders continue to enjoy a great "hit and run" trading environment. Good news for the bulls this week comes with all of the volume McClellan Oscillators finishing on Friday at or above their relief highs of the week before with the exception of both the NASDAQ and NDX volume MCO's which are showing a lessening of buying pressure. This lack of internal amplitude is also seen right now in the breadth MCO's with the exception there coming with the SPX, OEX and Dow breadth MCO's which saw higher pattern highs on Friday. This follow through strength now suggests that equity prices are likely to be buoyant as we go into the month of April, with the Large and Mid Cap value stocks leading the pace over those deemed growth issues that make up the Small Cap and NASDAQ Composite Index'. Friday's daily NYSE TRIN number of .60 has now pushed the NYSE Open 10 TRIN to near "overbought" levels at .81, while the NASDAQ Open 10 TRIN finished on Friday still on the frothy side at .70. In the options arena, call buying picked up significantly last week as the 10 day average of the CBOE and Equity put/call ratios finished at levels not seen since mid January. General sentiment remains even between bulls and bears, while implied put option volatility continues on the rich side in spite of the vigorous gains of the last week or so. When mixing all these ingredients together then, we're likely to see a choppy, if not volatile, week ahead as short term bulls try to convince intermediate term bears that the worse is now behind us with blue skies waiting just ahead. With all this in mind, investors should continue to watch the action from comfort of their desktops while beginning to put together a list of those sectors and issues that are leading the markets higher in case we get an "all clear" signal, while traders should maintain their "hit and run" trading strategies unless another thrust of investment capital is put to work where it would then be OK again to have more of a bullish bias.
Have a great trading week!
US Equity Markets: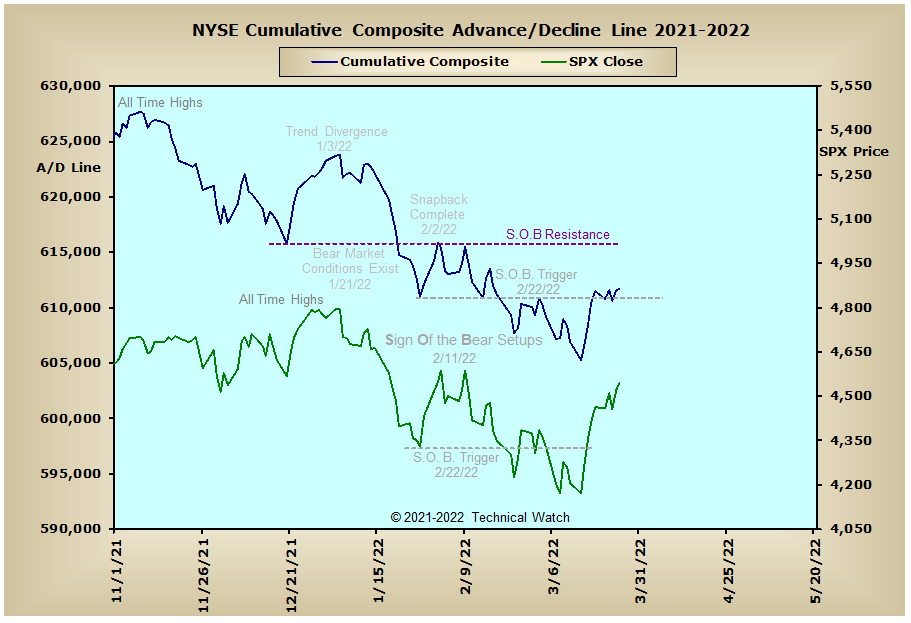

US Interest Rates: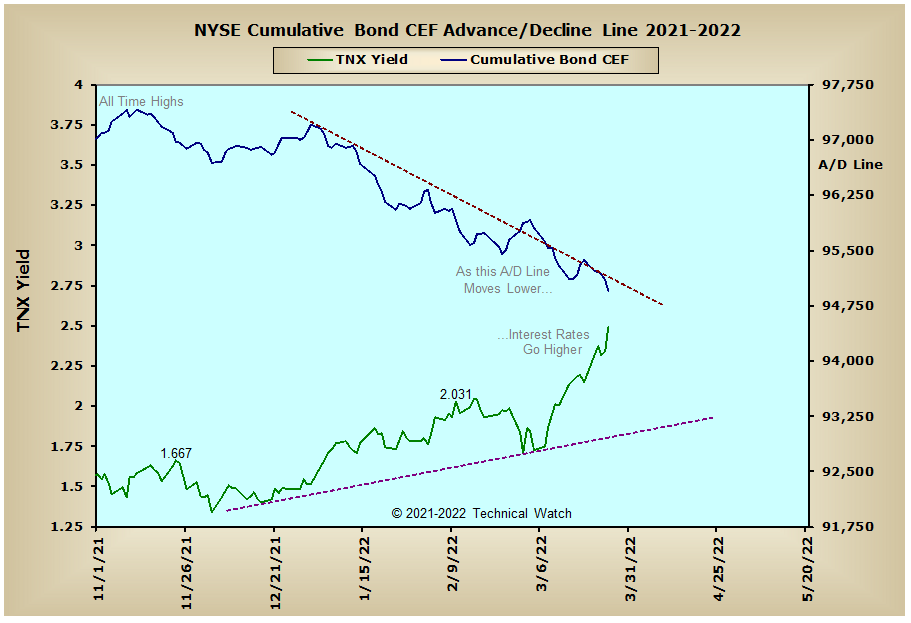
US Sectors: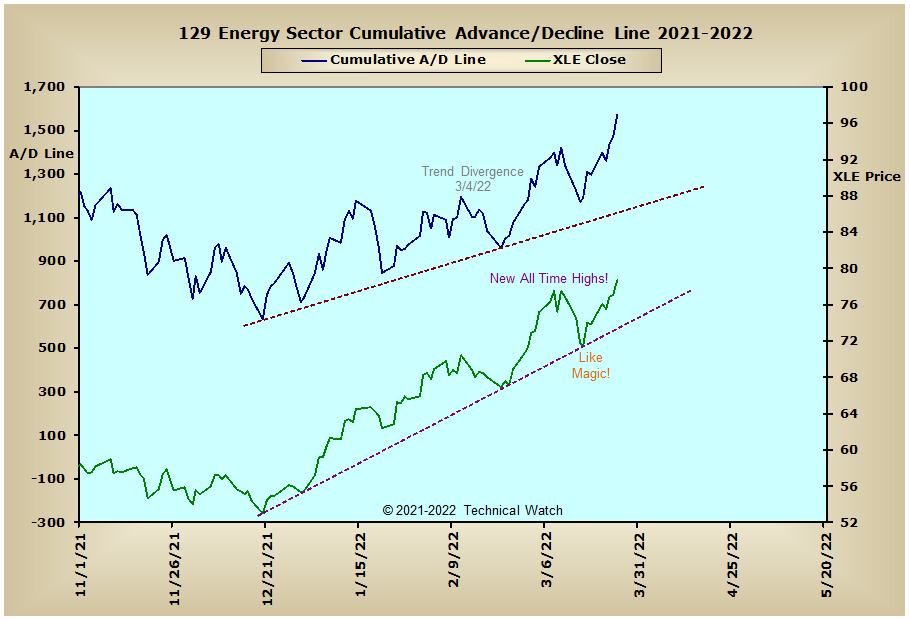
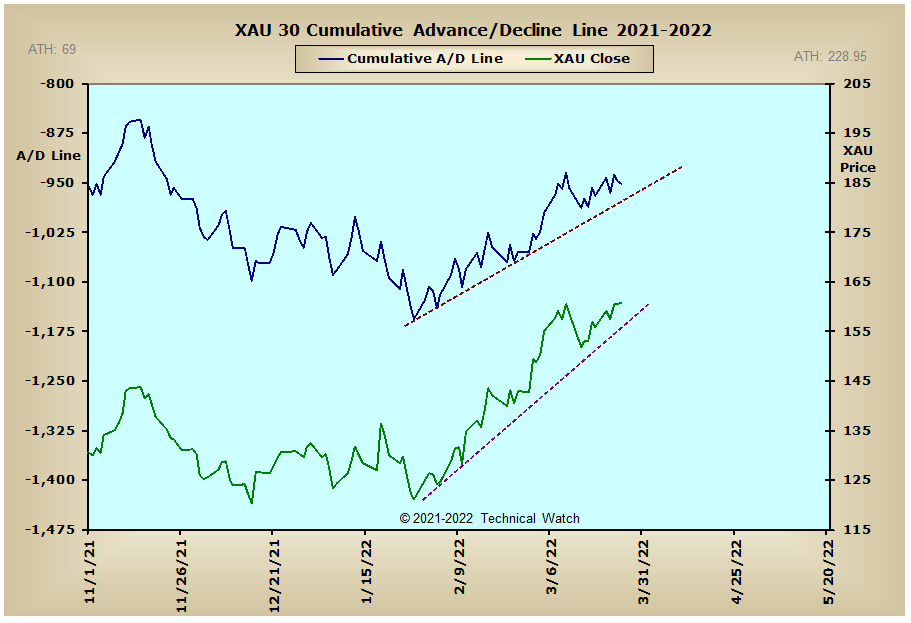
Precious Metals: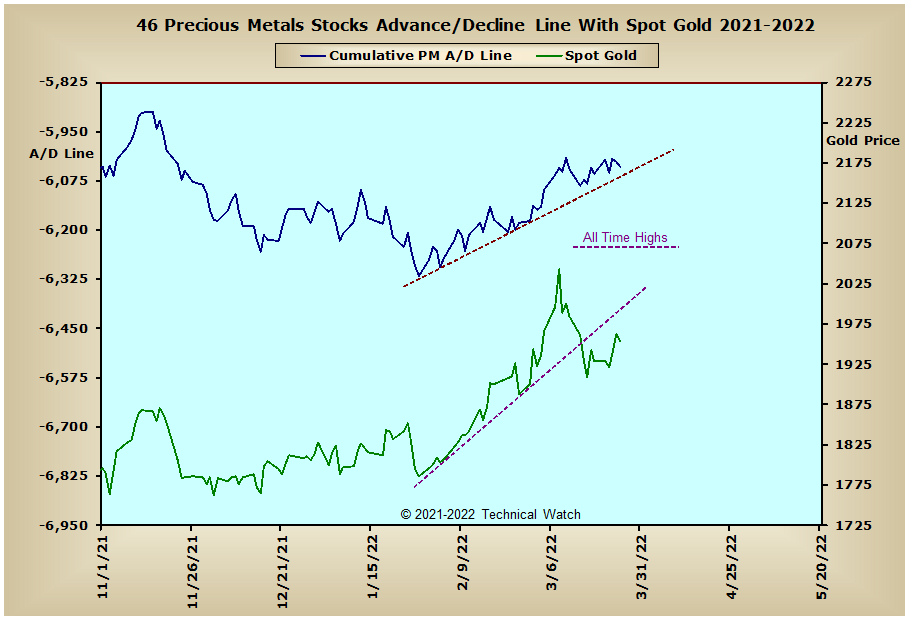
Australia: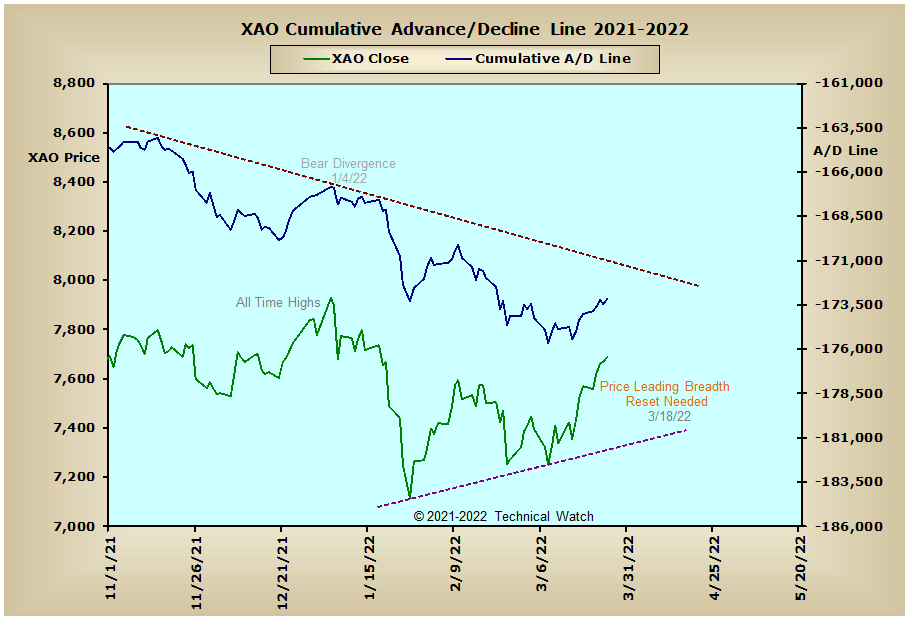
England: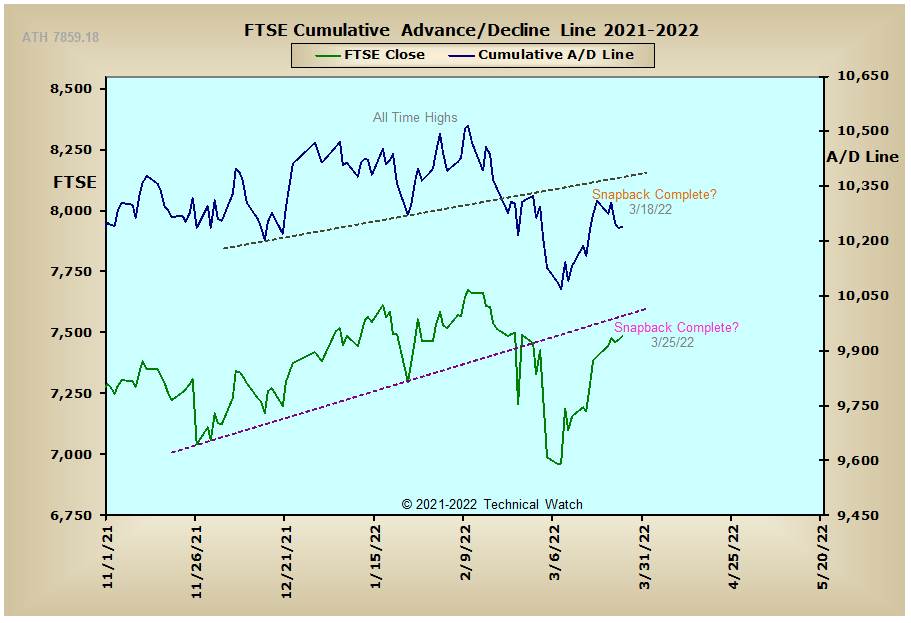
France: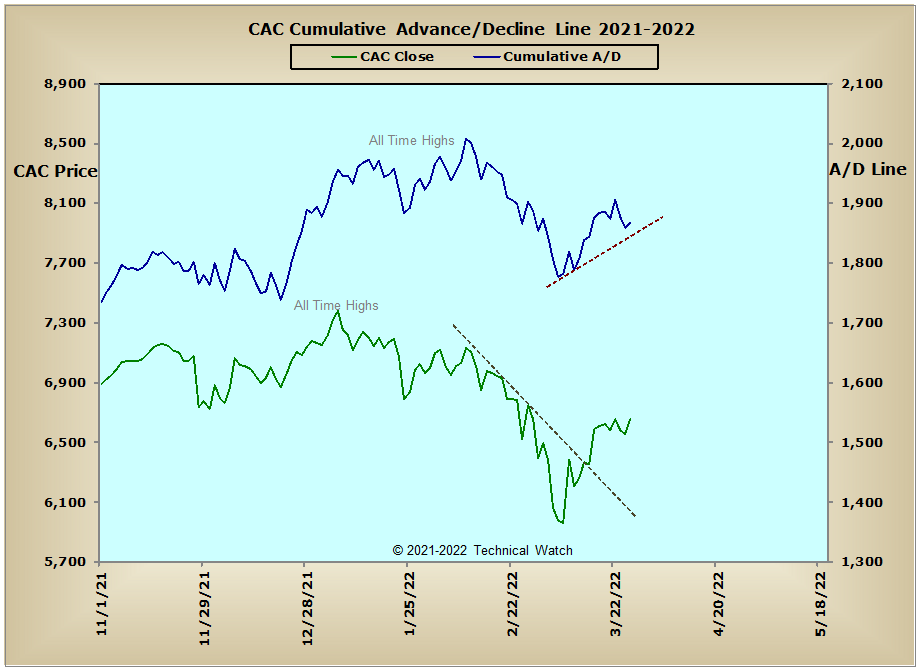
Germany: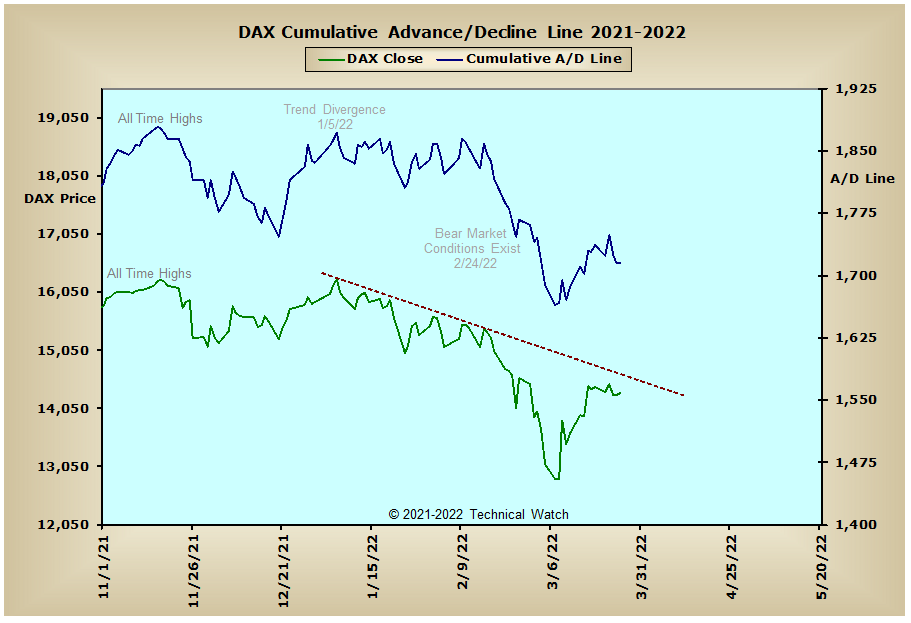
India:


