Happy Holidays, doing my weekly maintenance, annoying WINDOWS update, etc today... may do a few posts.
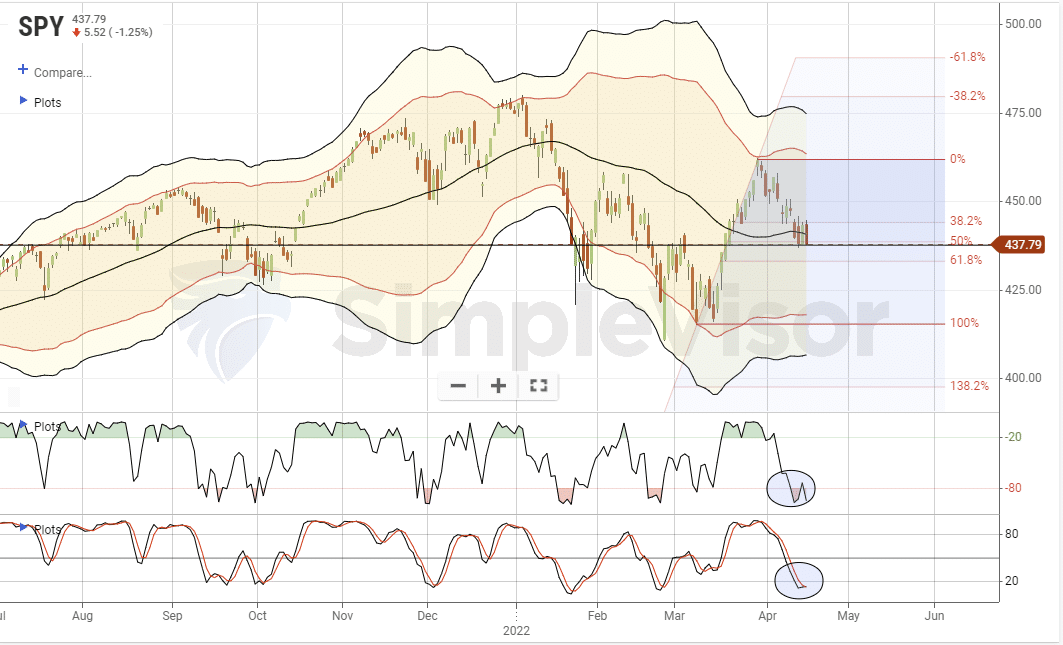
Here is an interesting "Sentiment" indicator, not necessarily a "SIGNAL" or a "TRIGGER"
I am NET LONG, slightly so, but I am building a LONG POSITION slowly..... could quicken the pace if a WASH-OUT ensues next week or so
Chart In Focus
Multiyear Records for AAII Survey
April 14, 2022
The American Association of Individual Investors (www.aaii.com) surveys its members every week to see if they are bullish, bearish, or neutral. This week’s data, released on Thursday, April 14, 2022, showed the most negative bull-bear spread since April 2013. The last time we saw negative sentiment like this in the AAII survey was in the summer of 2020, as investors were still worried about the Covid Crash that had unfolded in March 2020. That worry helped to fuel a long bull market. And the Fed’s QE helped a lot too.
https://www.mcoscill...or_aaii_survey/