
https://i.postimg.cc.../SPXPATTERN.png
history doesn' t repeat but often it rhymes
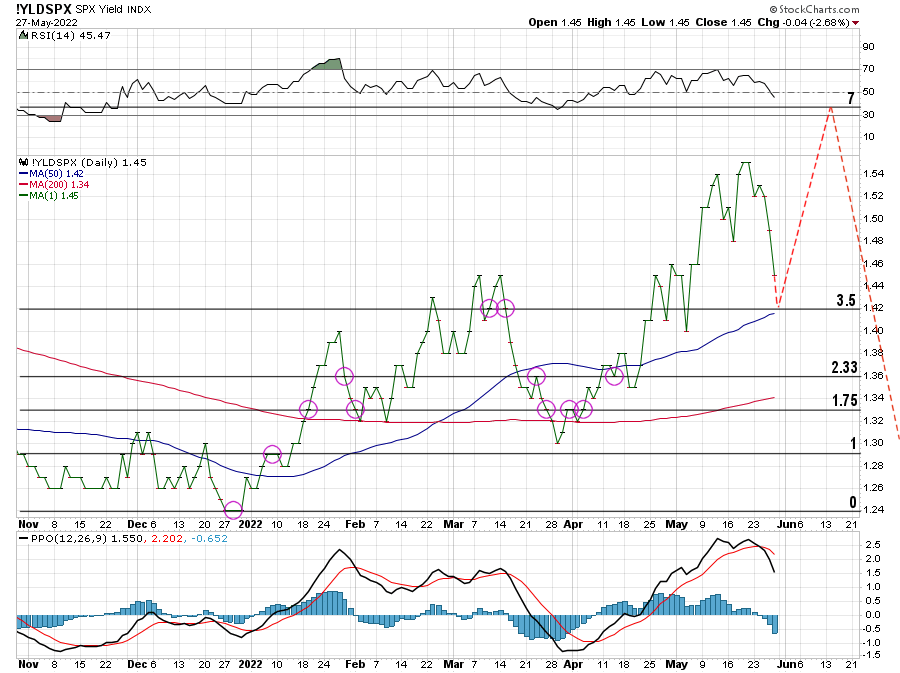
maybe it will give us the next IT top if it goes on rhyming again
that kind of pattern which I would call fake inverse h&s is more frequent than one could imagine
the next IT top might be around 13000 which is above my most recent expectations
Edited by andr99, 27 May 2022 - 09:58 AM.


