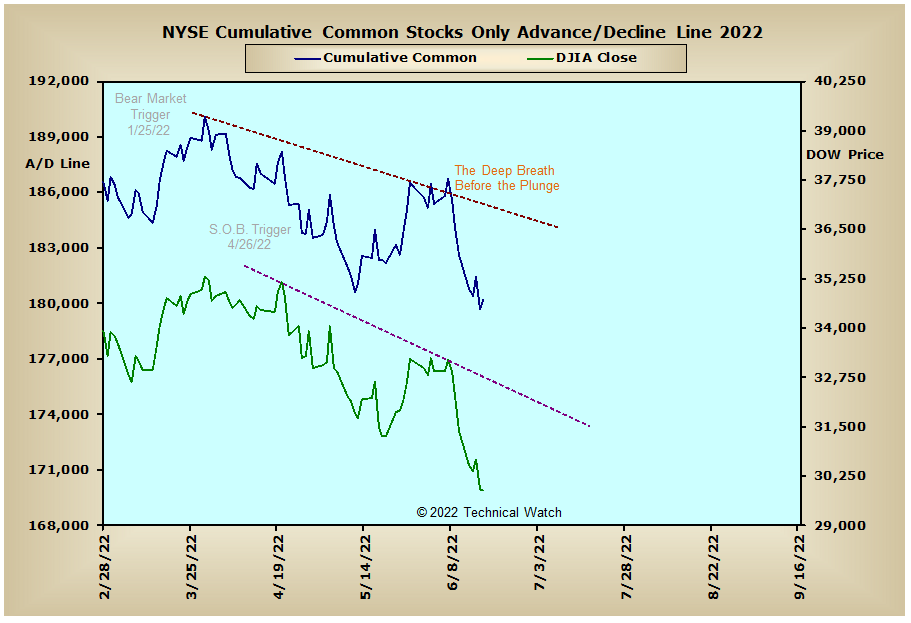
It was another rough week for the bulls as the major market indexes added on to the previous weeks hard decline to finish below the May price lows with an average loss of -6.25%. Leading the way lower this time around were the growth issues as the S&P 400 Mid Caps (-7.60%) and the S&P 600 Small Caps (-7.94%) continued to feel the pressure of a tighter credit market. Also noteworthy is that all of the major indices either closed at or below their longer term 200 week EMA's which is our technical proxy of the 4 year economic cycle.
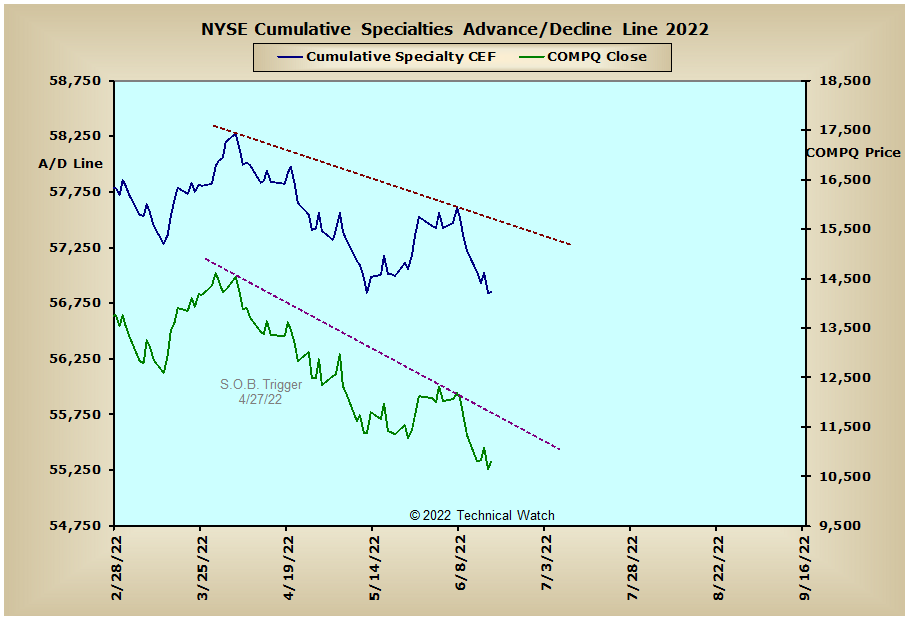
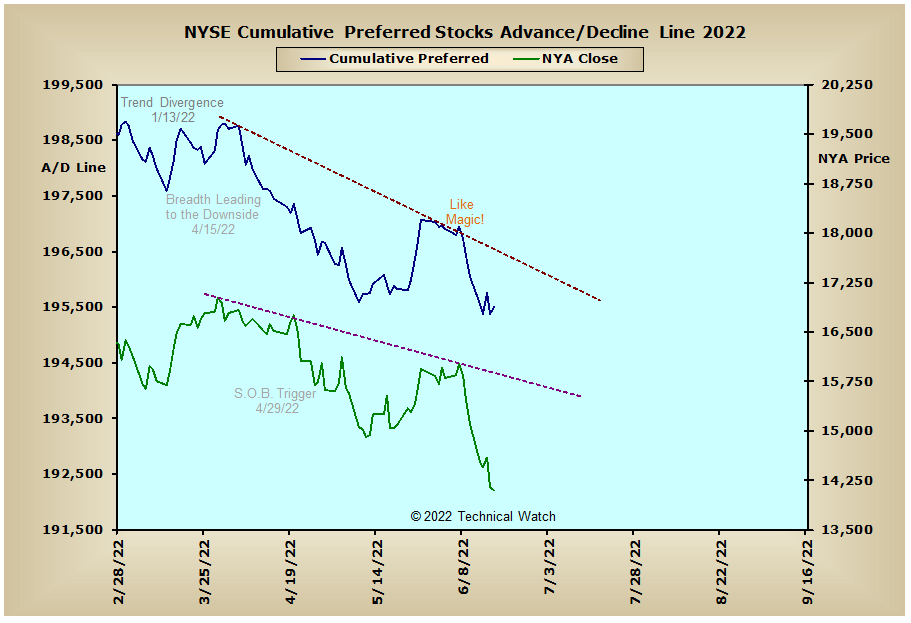
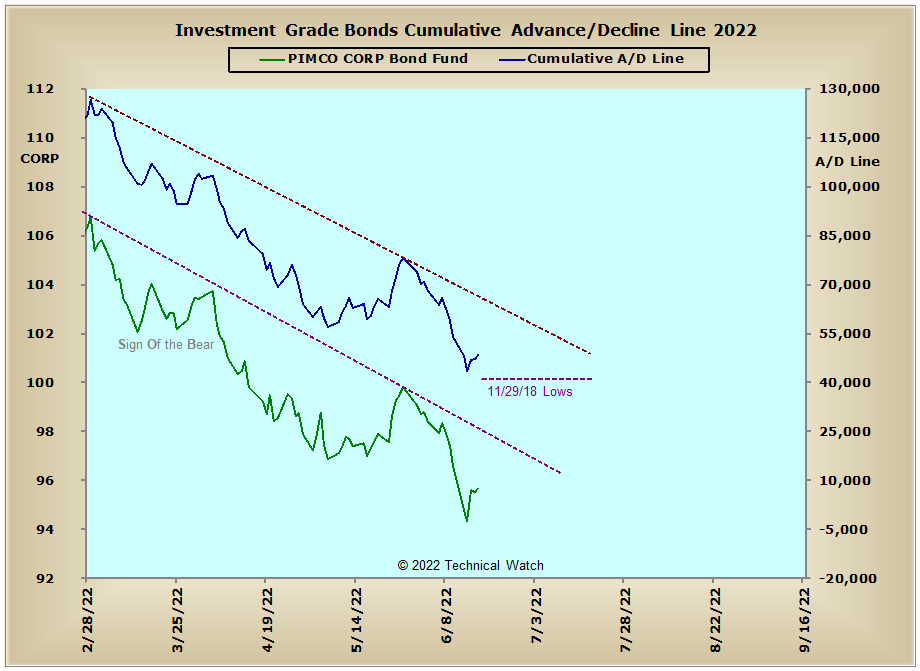
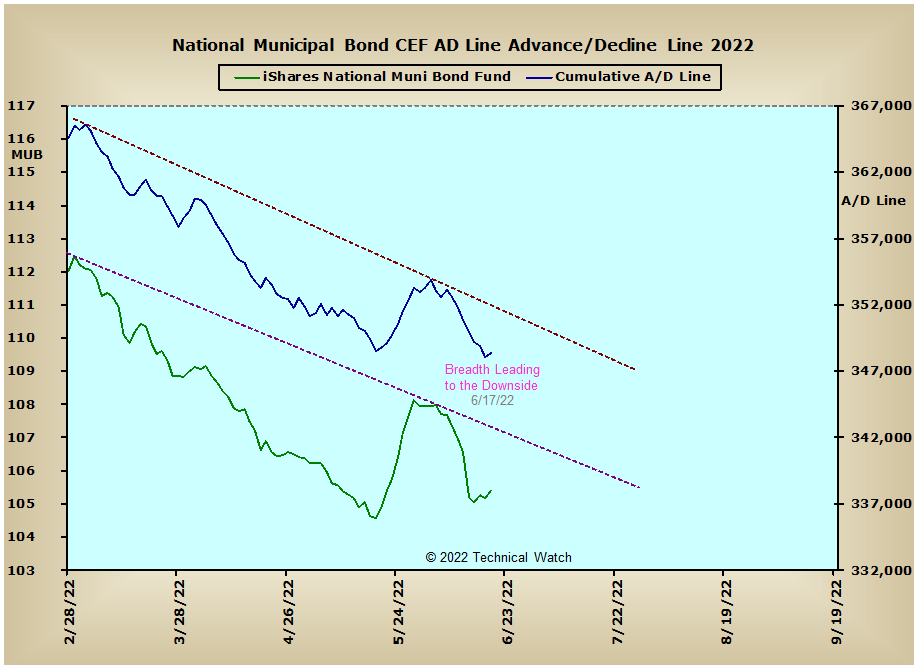
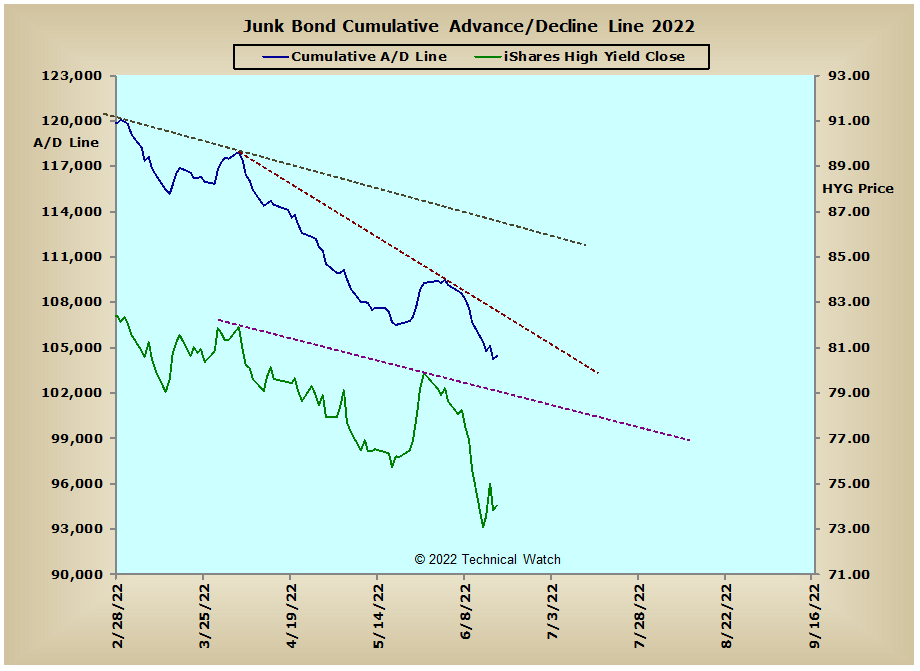
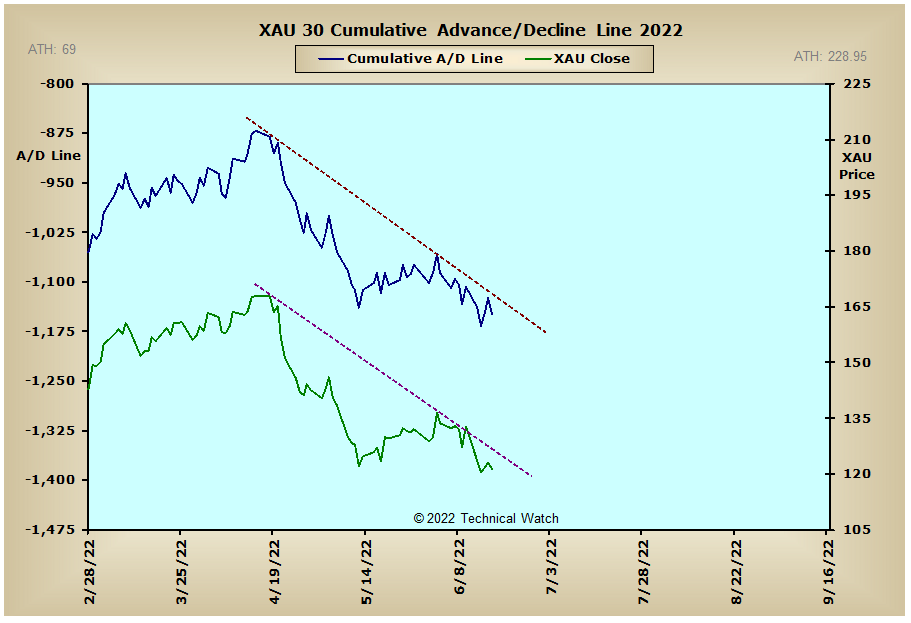
Looking over this week's array of cumulative breadth charts shows that the vast majority moved to new reaction lows as May price support gave way in many of the major market indexes on Monday. Money flow lines of the interest rate sensitive issues continue their longer term free fall as the yield of the 10 year note gaped above our upside target of 3.25% on Monday before partially filling this same gap to close out the week. If yields are able to turn immediately higher on Tuesday without filling this same gap, then the odds become greater that this gap will be labeled as a "breakaway" type which suggests further rate increases to or toward longer term pattern resistance at the 4% level and as high as 5.25%. While precious metals issues continue to weaken as interest rates rise, the longer term pattern of the Energy Sector advance/decline line still remains above its rising trendline of support in spite of energy stocks getting caught up in last week's sell off. Looking overseas, and we see that the Aussie advance/decline line continues to make new all time lows, while both the CAC and FTSE advance/decline lines made new reaction lows this past week, and this allowed their respective price indexes to breakout to the downside of their symmetrical triangles and generate new downside price targets. Lastly, we also cite that the NASDAQ advance/decline line (not shown here...see cumulative charts) finished the week just above the all time lows that were made just the day before.
So with the BETS moving to its lowest levels since the week ending December 21, 2018 at -75, we now have an all out sell signal under the umbrella of bear market conditions. Last week's selloff allowed all of the breadth and volume McClellan Oscillators to reach "oversold" territory, but only few actually took out their previous extremes of either last January and/or November of last year. Until this inconsistency between the indexes is remedied, we should expect further price erosion throughout the 3rd quarter months of July through September. Looking at the breadth and volume McClellan Oscillators, and we see that all saw a lessening of selling pressure with Thursday's decline, but only the NASDAQ volume MCO was able to trigger near term bullish divergence on Friday. The NYSE Open 10 TRIN continues to be deeply "oversold" at this time as it finished out the week at 1.48, while the NASDAQ Open 10 TRIN is now "overbought" with a reading of .75. The 10 day SMA of the CBOE and Equity Put/Call Ratios continue to trend higher as more and more put buying is traded, while put option premiums (mark ups) remain near their highs of the year. On another technical note, both the EMA and SMA versions of the Zweig Breadth Thrust indicator were reset over the last week with both currently showing readings of 35%. Taken together, we're deeply "oversold" in many areas, "overbought" in a few, while the index related MCO's remain out of sync. With all this as a backdrop then, let's go ahead and still continue to walk the bearish path of least resistance for the upcoming 4 day trading week, while watching out for the occasional bullish snort just to let us know they're still out there though battered and bruised.
Have a great trading week!
US Equity Markets: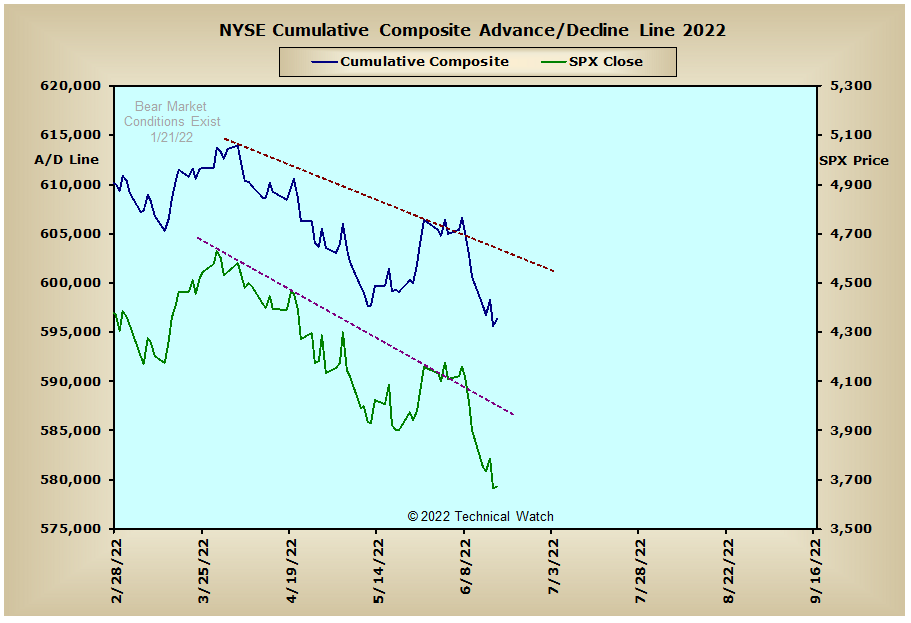

US Interest Rates: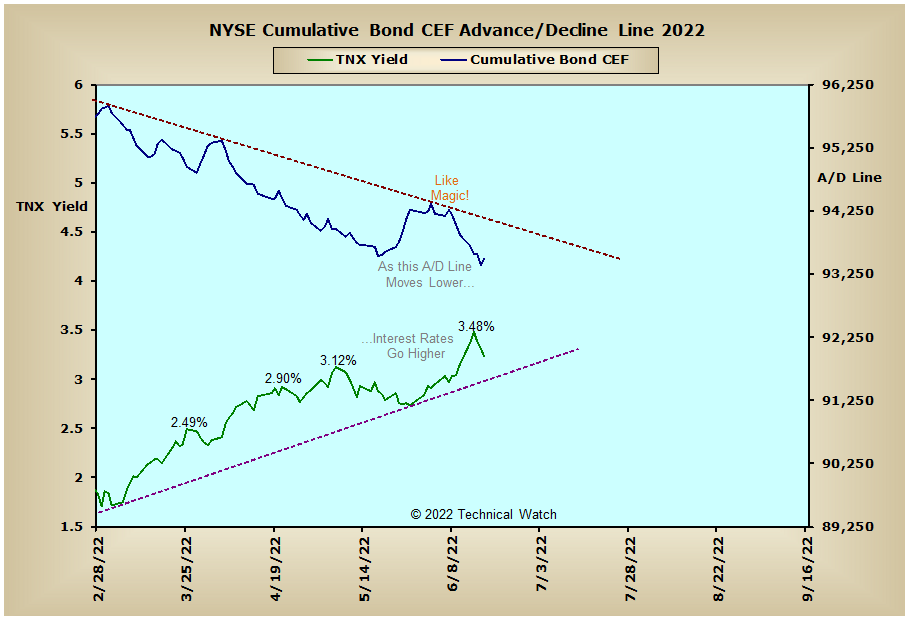
US Sectors: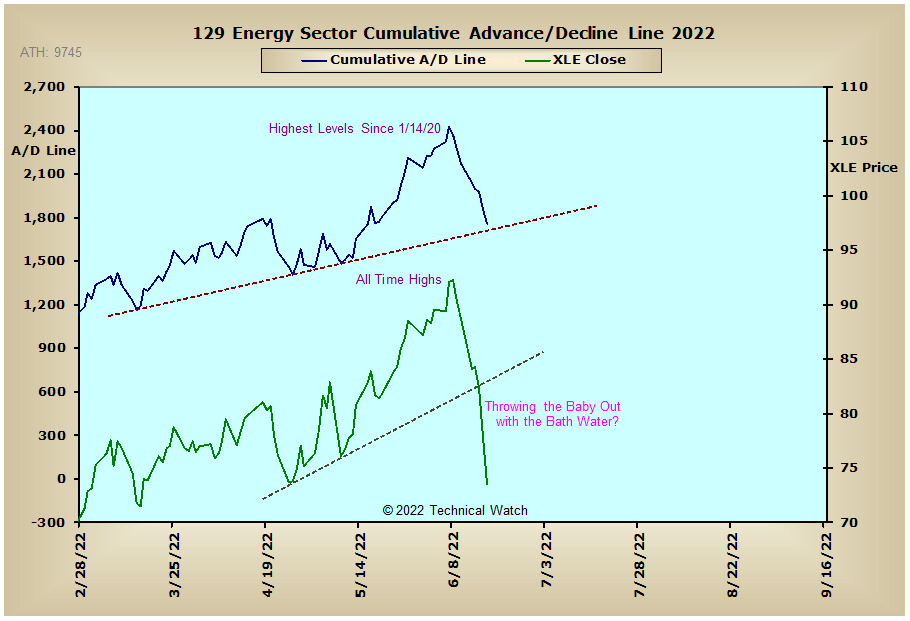
Precious Metals: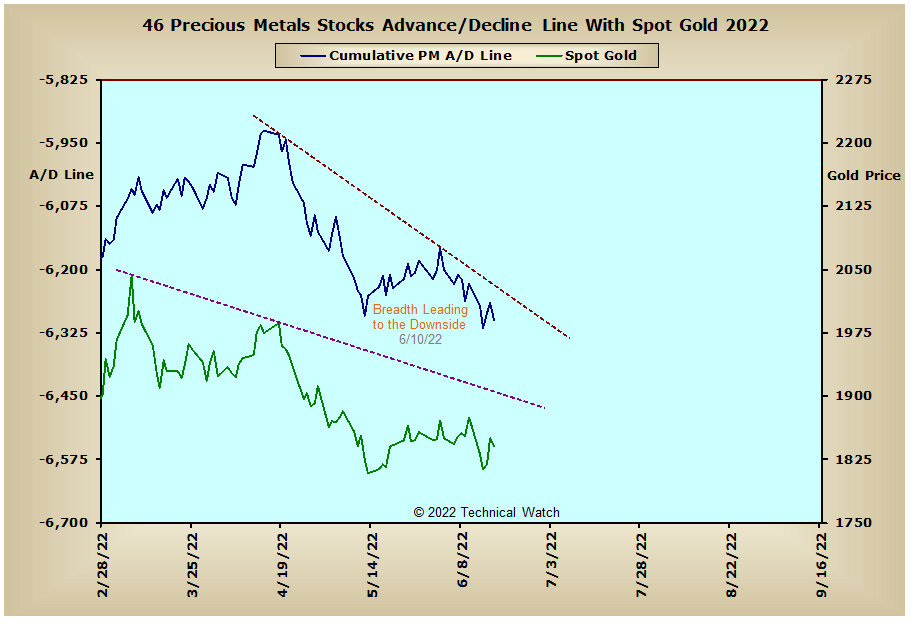
Australia: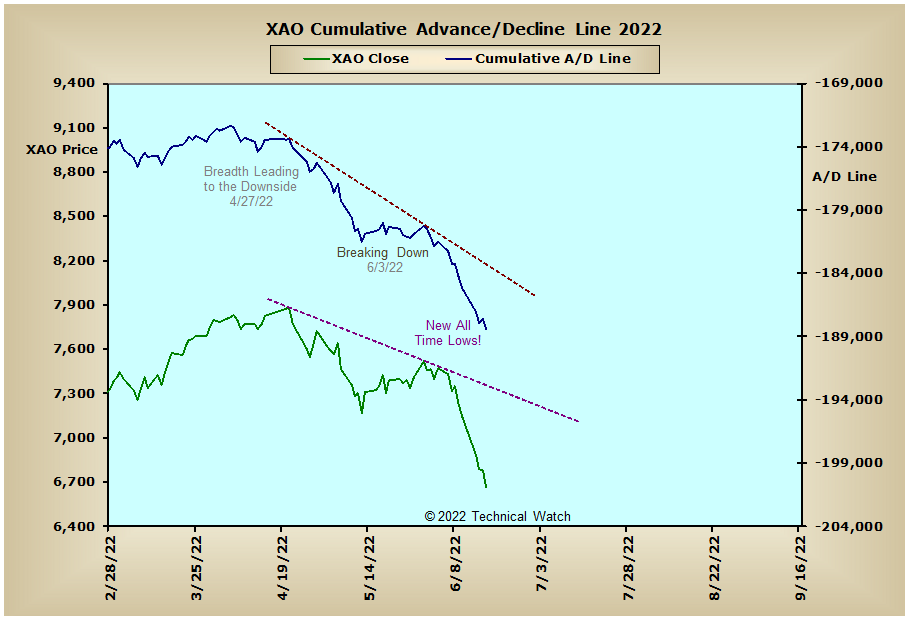
England: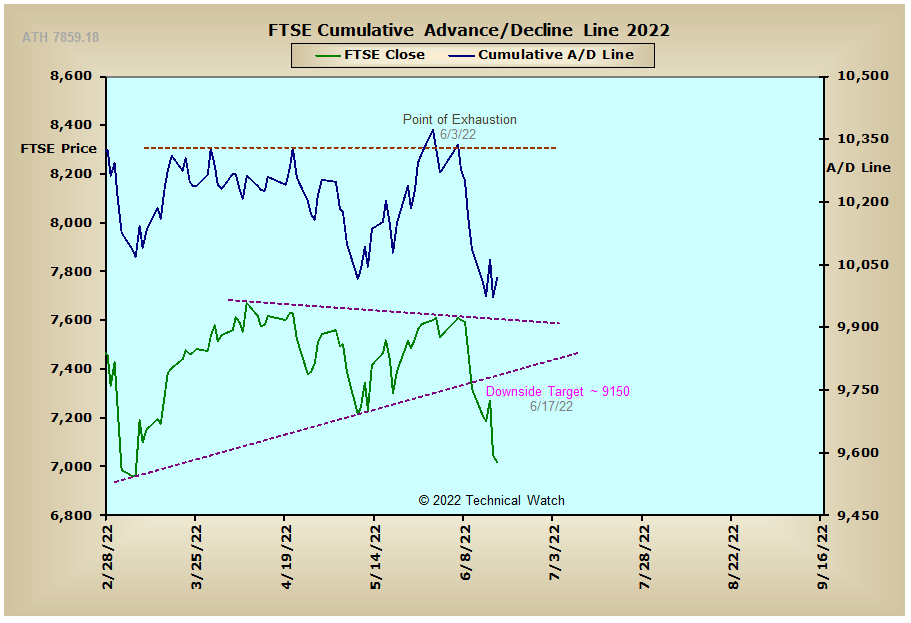
France: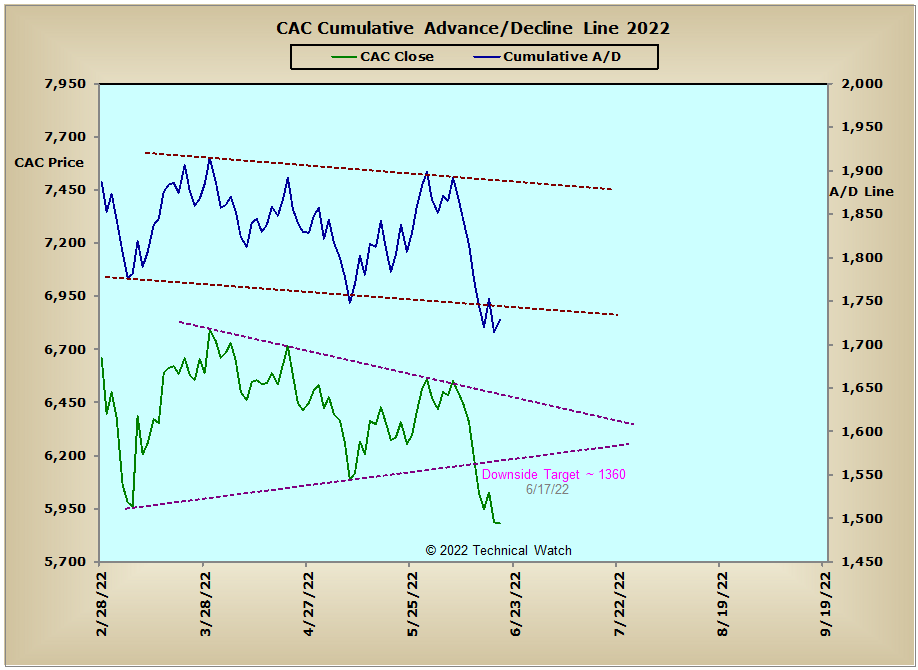
Germany: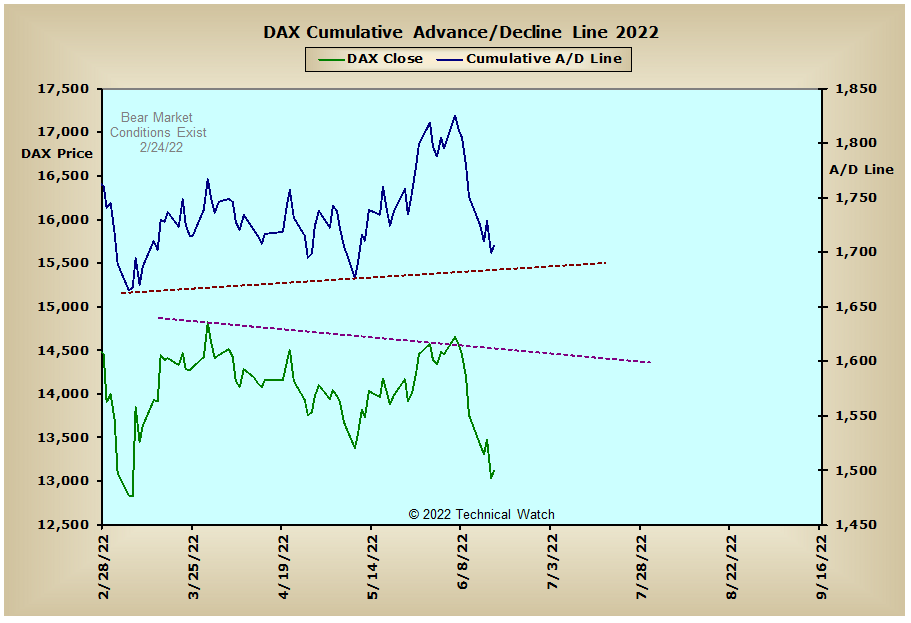
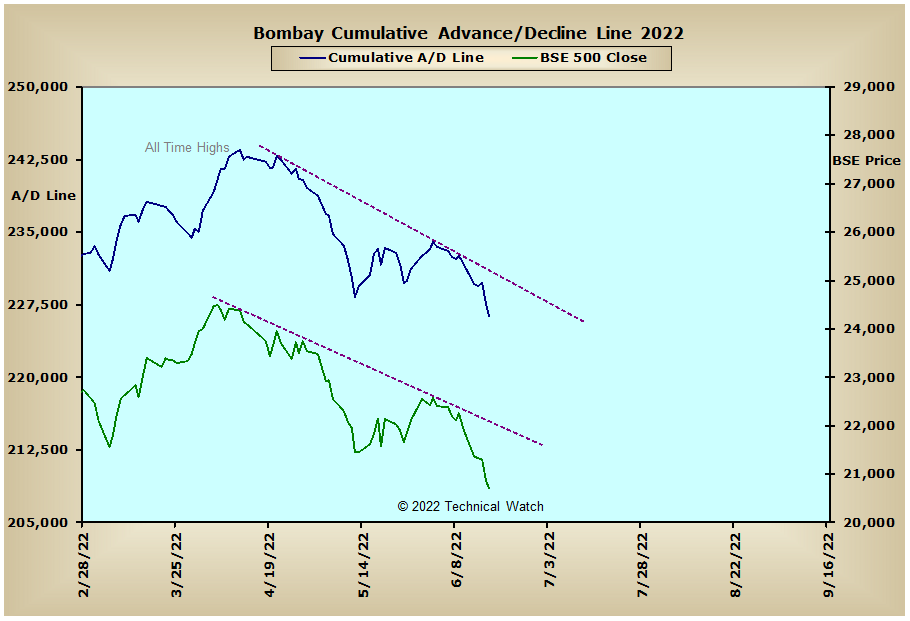
India: