Jump to content


Photo

Positive July Seasonality...BUT...Forget about it


  • Please log in to reply
11 replies to this topic

#1 Rogerdodger

Rogerdodger

    Member

  • TT Member*
  • 26,873 posts

Posted 02 July 2022 - 09:09 PM

Mike Burk's seasonality has been helpful.

Last week it was: Coming week: "Negative by all measures."  as the SPX finished down 86 points


But this coming week? Forget Seasonality?

Mike Burk:
 

The good news is:
The buy the dip crowd is alive and well. 

During the rally of a week ago we saw the highest volume in over 2 years.
Conclusion
Last week new lows returned to dangerously high levels.
Seasonality for next week is positive, however I think the buy the dip crowd had its day.


Other views:

July stock market seasonality:

  1. July is up only 48% of the time, tied with September for the worst month.
  2. The average return for July is 0.38%.
  3. July 2nd is historically the 5th worst day of the month.
  4. July is up 3 years in a row, tied for the longest streak over 50 years. ...
  5. The worst July return ever was -7.9% in 2002, the second best max drawdown for any month.

spx-july-seasonality-1.png


Edited by Rogerdodger, 02 July 2022 - 09:30 PM.


#2 pdx5

pdx5

    I want return OF my money more than return ON my money

  • Traders-Talk User
  • 9,527 posts

Posted 02 July 2022 - 09:31 PM

Yes, with 8.6% inflation all usual rules can be thrown out. Next inflation reading comes out mid-July.

That will shed a lot of light where the market is headed.


"Money cannot consistently be made trading every day or every week during the year." ~ Jesse Livermore Trading Rule

#3 GDA

GDA

    Member

  • Traders-Talk User
  • 120 posts

Posted 03 July 2022 - 12:39 AM

Mike Burk's seasonality has been helpful.

Last week it was: Coming week: "Negative by all measures."  as the SPX finished down 86 points


But this coming week? Forget Seasonality?

Mike Burk:
 

That call was made on the 19th, and the SPX went up 200 points that week.


#4 Rogerdodger

Rogerdodger

    Member

  • TT Member*
  • 26,873 posts

Posted 03 July 2022 - 09:23 AM

That call was made on the 19th, and the SPX went up 200 points that week.


I stand corrected as I mixed up the dates!

It was the earlier week  that was the miss, as he acknowledges:

Here was last week's call which was correct.


Technical Market Report For Saturday, June 25


I expect the major averages to be lower on Friday July 1 than they were on Friday June 24.

Last week's negative forecast was a miss.


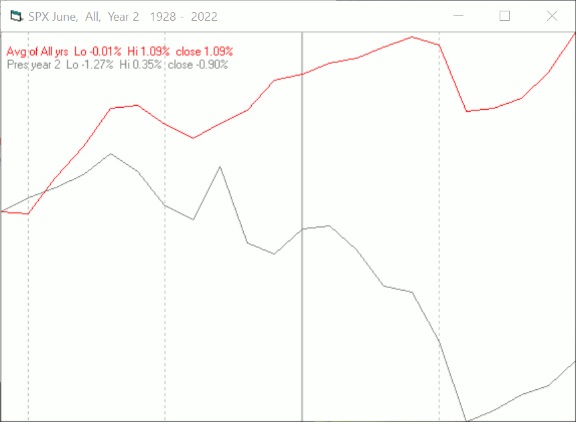
Overall the stats on the 2nd Presidential Year June was darn good:

SPX dropped 378 points for the month

And down 86 points just last week.

June-seasonality.jpg


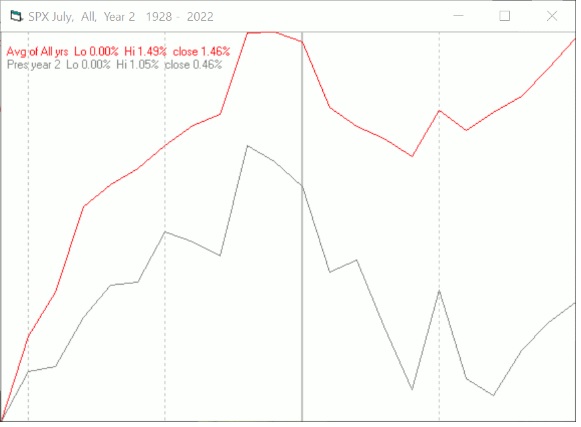
Here is the SPX stats for July, 2nd Presidential Year:

July-Seasonal.jpg


Edited by Rogerdodger, 03 July 2022 - 12:39 PM.


#5 GDA

GDA

    Member

  • Traders-Talk User
  • 120 posts

Posted 03 July 2022 - 12:43 PM

As mentioned before, his seasonal forecast is  not better than the flip of a coin. 


#6 pdx5

pdx5

    I want return OF my money more than return ON my money

  • Traders-Talk User
  • 9,527 posts

Posted 03 July 2022 - 01:06 PM

Seasonality is based on average actual performance from the past.
So it has that going for it.

Key word is AVERAGE. It can have significant standard deviation in any particular year based on economic conditions during that year.

Which simply means seasonality is not accurate in every year.
"Money cannot consistently be made trading every day or every week during the year." ~ Jesse Livermore Trading Rule

#7 Rogerdodger

Rogerdodger

    Member

  • TT Member*
  • 26,873 posts

Posted 03 July 2022 - 04:31 PM

His seasonal forecast is fact based data.

His personal interpretation isn't.


Seasonality is just one tool in a tool box.


Airplane pilots look at weather forecasts and often change course based on ever changing weather.

Sometimes they even look out the window.


instruments.jpg


Edited by Rogerdodger, 03 July 2022 - 04:45 PM.


#8 K Wave

K Wave

    Member

  • Traders-Talk User
  • 26,822 posts

Posted 03 July 2022 - 07:00 PM

While this could time could always be different, my big swing downside targets have been essentially hit.


And with MSM headlines blaring WORST FIRST HALF SINCE 1962, AND ALMOST 1932....


uhhh..some pretty good rallies after those lows....


Not going to go real long until SOX hops on the corner turn band wagon, but that may come on Tuesday....


Only looking for summer rally here, October could be brutal...


IF...SOX does not turn, and we start breaking daily 900s (Rusty already has), then may have to adjust my thinking.


Have been liking the leadership action over at FDX, and unless it suddenly breaks, I think it is just about to lead a turn back up for a while.

But should that pop over the 200 day turn out to be a huge throwover and FDX comes crashing back through the 900, then bull bets may have to shelved


My time frame for the turn is Early July, and we are now there, so now we see if bull can finally take it back for a while.


FWIW, 1962 turned near end of June, and 1932 first week in July


fdx.png


The strength of Government lies in the people's ignorance, and the Government knows this, and will therefore always oppose true enlightenment. - Leo Tolstoy


#9 K Wave

K Wave

    Member

  • Traders-Talk User
  • 26,822 posts

Posted 03 July 2022 - 07:04 PM

Also possible that a crude crash fuels the rally...


looking like it is about to make potentially big decision either tonight or tomorrow...


The strength of Government lies in the people's ignorance, and the Government knows this, and will therefore always oppose true enlightenment. - Leo Tolstoy


#10 Rogerdodger

Rogerdodger

    Member

  • TT Member*
  • 26,873 posts

Posted 04 July 2022 - 10:17 AM

my big swing downside targets have been essentially hit.


I like the monthly view for a bigger picture.

NYSE touched the Monthly 50ma in June for a bottom.

A similar pattern occurred in 2008-2009's drop.

The Monthly RSI has now tried to turn up from below 50, just as in did in 2008.

Price then regained 61,8% of the losses from the top before the bottom fell out, dropping from 10,387 to 4,181 3+ years later.

All the while, the monthly MACD plunged the whole time, as it is doing now.

See: https://schrts.co/wShsgeSv