It should not need saying that this is a dummy's analysis of TLT.
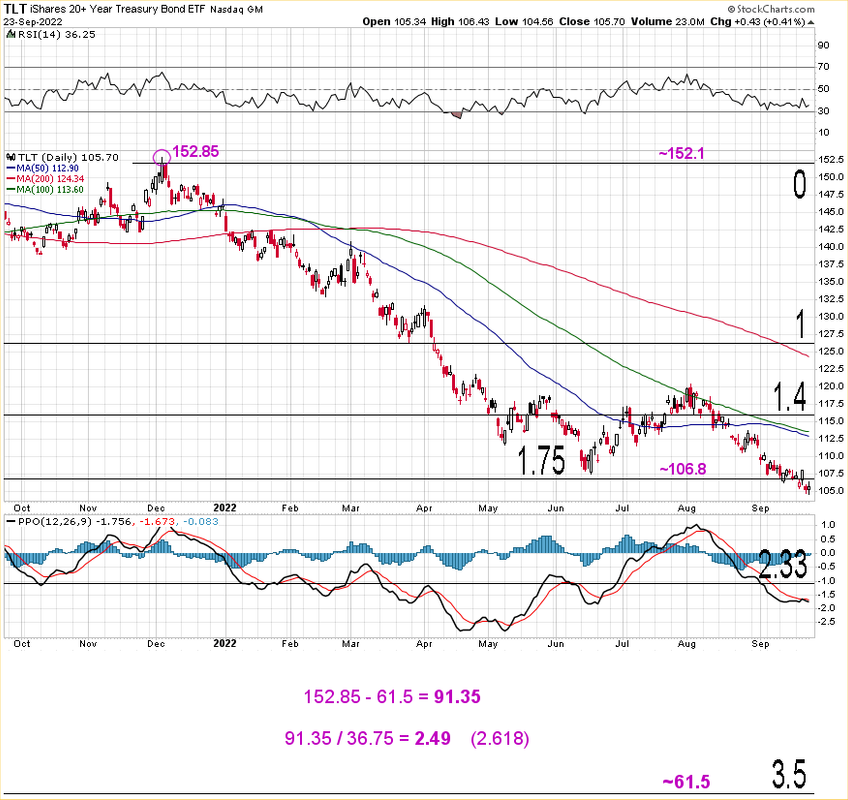
The 1st leg down between Aug '20 and Mar '21

The 1st leg up between Mar and Dec '21

The 2nd leg down between Dec '21 now

I've never gotten into the 'wave' stuff, but i'm assuming that the above legs fit inside of waves having ampltudes of 36.75 down, 23.15 up and 48.29 down. I found this chart on a random website, https://www.metatrad.../elliott_theory and I have no idea if it is accurate or not.
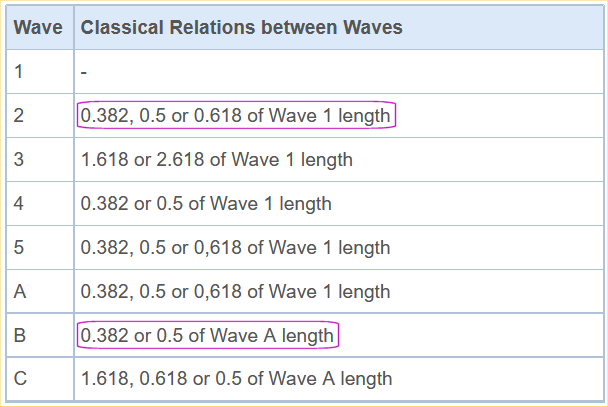
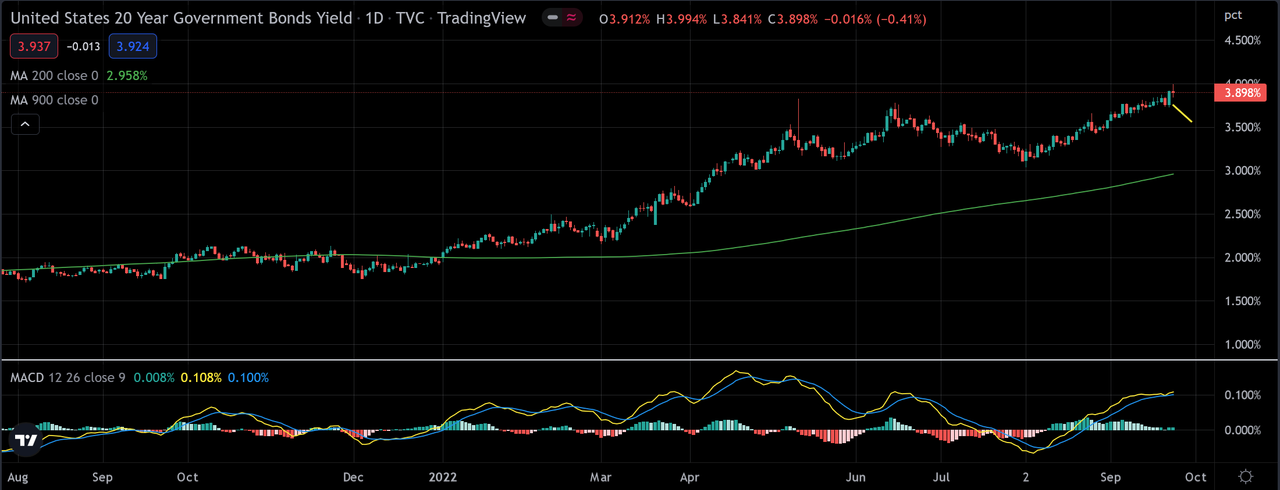
The ratio between the 2nd and 1st waves of TLT is 23.15 / 36.75 = 0.63 (0.618), so I am assuming we have a 5 wave structure. This could be reasonable with a simple shift of perspective from that of a bear market in bonds to a bull market in bond yields.
The ratio between the 3rd and 1st waves is 48.29 / 36.75 = 1.314, which is much lower than either 1.618 or 2.618, so I am assuming that the 2nd leg down is not yet complete, and I am tossing the 3rd chart from the top and replacing it with one or the other of the following charts (yet to be determined which).