Jump to content


Photo

Risk Windows for the Week of September 26th & the First Rule of Holes


  • Please log in to reply
12 replies to this topic

#1 Douglas

Douglas

    Member

  • Traders-Talk User
  • 1,826 posts

Posted 25 September 2022 - 05:51 AM

According to my risk summation system, the days this coming week or so with the highest risk of a turn in or acceleration of the current trend in the DJIA are Monday September 26th and a somewhat wide window stretching from the afternoon of Thursday September the 29th through the morning of Monday the 3rd of October. 


Last week's Wednesday the 21st risk window lived up to its label tagging an apparently important turn down and wide swings up and down as the market tried to digest the undercooked gruel dished up by Chef Powell.   


N9KIQcU.png


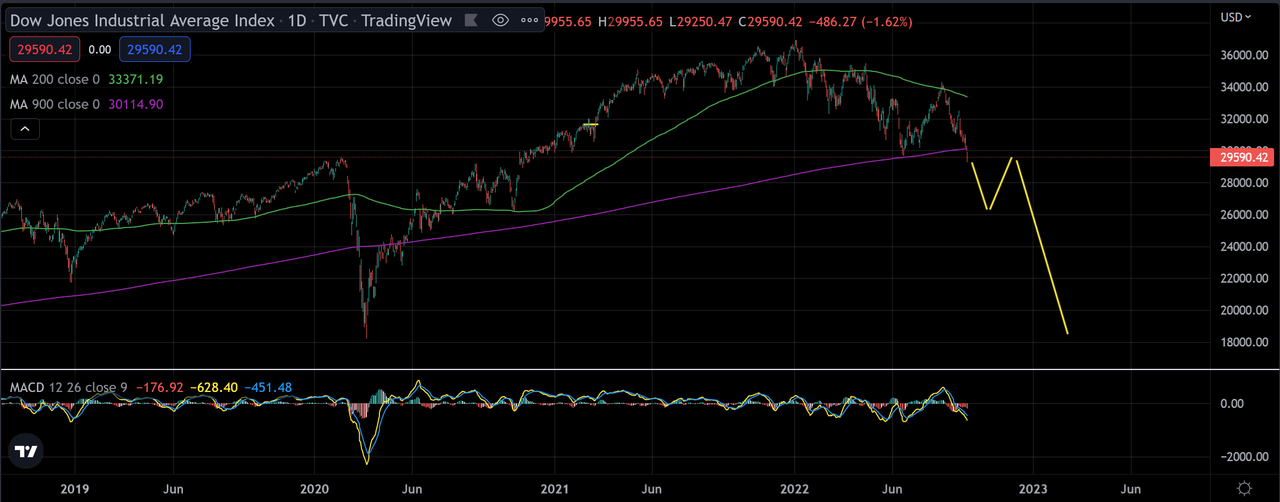
The crash risk window that I noted last week theoretically closes tomorrow, or maybe not, maybe the Fed's largesse noted below has stretched the crash window.  I suppose I'll only know in 20-20 hindsight.  I don't think the 1700+ DOW points lost in the last half of last week really constitutes a crash, so unless things get really nasty on the new moon rise tonight, I guess this dark harbinger will just have to sulk back into his cave and wait until the next crash risk window in about a month, 


Speaking of caves, or rather big holes, the British Pound certainly fell into one this past week.  For some reason that I can't fathom, the new UK government, right out of the gate, has broken the first rule of holes, when you are in a hole, stop digging.  If they were in a trade war, I could understand the move, but they're in an inflation war and lowering the value of the currency drives up inflation.  They and Putin both appear to have been reading from Sun Tzu's less popular book, The Art of Losing a War in Three Easy Steps.  I would love to be a fly on the wall at the next meeting of the BOE Head and the Exchequer.  I suspect language unsuitable for BBC prime time will be liberally thrown about the room. 


As to trades, the chart below using an fxtop.com plot shamelessly based on Larry Pesavento's three drives to a bottom technique shows a path for the Pound to substantially break the buck which is a big deal no matter which side of the pond you live on.  I plan to keep buying the Pound as it falls in the knowledge (read hope) that soon common sense will prevail, and steps will be taken to right the Pound before a full-blown currency crisis erupts and this chart projection is made a reality. 


MobQKm6.png


As I pointed out last week and is still true, the Fed is not selling off debt securities from their balance sheet at anywhere near the 80 or 90 billion per month rate they stated in their inflation fight plan. As the Fed plot below shows, they are currently running off about 35 billion a month less than 40% of their plan.  Given the stock market crash risk window that we have been passing through, I guess I can't blame them, especially considering their unspoken third mandate, the S&P 500.  Maybe that's why the drop, at least so far, has been controlled and not a crash.  Over the last couple of weeks, it's clear that Doctor Powell fully intends to continue to pursue his slow and steady inflation cure experiment.  I just don't believe the economic patient will be willing to suffer too long before demanding a quicker treatment for what ails him.       


RXrW8pg.png


The continued oil price plunge is probably also filling the Fed with false inflation hope.  The rig count as shown in the oilprice.com plot below has been more or less flat since the crude price peak in June probably due to the price incentive for increased production slipping away.  Lower prices at the pump are not discouraging growing consumption, so at some point the demand and supply curves will once again cross, resulting in soaring prices and more inflation, probably just after the Fed declares inflation victory.  


NeBYyk1.png


Regards,

Douglas


#2 fib_1618

fib_1618

    Member

  • Traders-Talk User
  • 10,145 posts

Posted 25 September 2022 - 09:46 AM

Just to let you know, your posts are highly appreciated…thank you for your continued efforts.


Fib


Better to ignore me than abhor me.

“Wise men don't need advice. Fools won't take it” - Benjamin Franklin


"Beware of false knowledge; it is more dangerous than ignorance" - George Bernard Shaw


Demagogue: A leader who makes use of popular prejudices, false claims and promises in order to gain power.

Technical Watch Subscriptions


#3 beta

beta

    lasergirl

  • TT Patron+
  • 4,089 posts

Posted 25 September 2022 - 12:51 PM

"Last week's Wednesday the 21st risk window lived up to its label tagging an apparently important turn down and wide swings up and down as the market tried to digest the undercooked gruel dished up by Chef Powell."    -- an understatement !   Your weekly turn model certainly nailed this one.  yes.gif


Truly appreciate & look forward to your weekly updates.


Edited by beta, 25 September 2022 - 12:52 PM.

"Daytrading -- An Extreme Sport !"

#4 Douglas

Douglas

    Member

  • Traders-Talk User
  • 1,826 posts

Posted 25 September 2022 - 02:55 PM

fib_1618 & Beta, right back at you. I've learned so much from you guys over the years that I use every day in my analysis and decision-making process regarding the stock market. 


As Mike Tyson famously said, "everyone has a plan until they get hit in the face".  My plan is shown below which I hope to follow unless (until) the market hits me in the face.  I assume the "Bottom" is next year some time, depending on how complex the "B" wave turns out to be.  I "plan" to do some buying at the "A" low hopefully in no more than a few weeks.  My signal system has been sitting on a buy for some time.  I have been waiting on a complete E-Wave count or breaking the stop to trigger a buy.  That time appears to almost be at hand.


OUVBZIf.png

The following is my primary count for development of the "A" wave down to about 27,000 DJIA.  In my alternate count, the waves move down a degree, for example the "a" wave below becomes wave "i" of "a", so the march down takes more time and is messier, but still ends up at roughly the same place:


63H7uy8.png


The chances of the above working out exactly as shown are just barely this side of zero, but you got to have a plan.


Regards,

Douglas


Edited by Douglas, 25 September 2022 - 02:57 PM.


#5 linrom1

linrom1

    Member

  • Traders-Talk User
  • 3,997 posts

Posted 25 September 2022 - 03:00 PM

As I pointed out last week and is still true, the Fed is not selling off debt securities from their balance sheet at anywhere near the 80 or 90 billion per month rate they stated in their inflation fight plan. As the Fed plot below shows, they are currently running off about 35 billion a month less than 40% of their plan.


The reason for this is simply timing, before these will show up on balance sheet.


#6 Rogerdodger

Rogerdodger

    Member

  • TT Member*
  • 26,870 posts

Posted 25 September 2022 - 03:39 PM

Simultaneous rate hikes could lead to a 'string of financial crises,' warns World Bank


The global trend of oversized interest rate hikes by many central banks is a risk to the world economy.

This kind of "a degree of synchronicity" between central banks has not been witnessed over the past five decades, said the bank in a new study published last week. But their efforts don't guarantee that the stubbornly high inflation will return to the levels needed.


#7 Douglas

Douglas

    Member

  • Traders-Talk User
  • 1,826 posts

Posted 25 September 2022 - 04:20 PM

linrom1, I'm sorry, but I don't understand your comment above.  The data I showed I believe to be straight from the Fed's own website and the last figure was dated just this past Tuesday September 20th, so I would expect it to reflect the balance sheet value on that date and include the impact of any sales of securities by the Fed over the previous week.  What am I missing, or how am I misinterpreting the data shown? 


The Total Asset value on the 30th of August was 8,826,093 million and the value on this past Tuesday September 20th was 8,816,802 million or about a 9.29 billion in security sales over this period.   There are 8 business days after September 20 in which they will need to sell 8 times as much debt as they sold in the first 14 days in order to reach their projected run off of 80 to 90 billion/month.   


The web site is www.federalreserve.gov/monetarypolicy/bst_recenttrends.htm .   Thanks in advance for any help that you can provide me to understand this important data.  My degrees were in engineering, not accounting, so there is every possibility that I do not understand what I am seeing in the total asset plot.


Regards,

Douglas


Edited by Douglas, 25 September 2022 - 04:23 PM.


#8 linrom1

linrom1

    Member

  • Traders-Talk User
  • 3,997 posts

Posted 25 September 2022 - 08:18 PM

Ok, I 'll make it very simple. It takes time to close these transactions. Hence they might not show up on the books for several months.


Edited by linrom1, 25 September 2022 - 08:18 PM.


#9 Douglas

Douglas

    Member

  • Traders-Talk User
  • 1,826 posts

Posted 26 September 2022 - 02:19 AM

linrom1, thank you very much for taking the time to respond to my query.  I am constantly trying to improve my understanding of what the Fed is actually doing versus what they are saying since they have an outsized impact on both the stock and currency markets that I participate in.   


I mistakenly thought that the Fed would immediately book sales/purchases of securities, but for some reason that I don't yet understand they take 1 to 3 months to settle these trades and then book them on their balance sheet.  So, apparently the data that I am seeing in the plot that I have attached above from the Fed site actually is old data only reflecting the purchases/sales made as of June or July before the heavier run off.    


Apparently, the Fed does publish the current security purchases and sales each week, they just don't "book" them on the balance sheet, so they don't appear on the graph that I have been watching.  I have been poking around the Fed's web site trying to find where they publish the current security sales, so I can see in real time what they are doing to their balance sheet instead of waiting a month or more for it to appear in the H.4.1 publication. When I find this data, I will update the plot to show what the Fed is actually doing NOW.  


I apologize to anyone who has seen the plots that I have published and thought due to my rantings that they reflected current data.  My bad.  Old data, unlike old scotch or wine, is not good.


Thanks again for the education.  Like I said, I don't have an accounting background, so I'm constantly learning.  


Regards,

Douglas


#10 K Wave

K Wave

    Member

  • Traders-Talk User
  • 26,639 posts

Posted 26 September 2022 - 07:27 AM


OUVBZIf.png


Regards,

Douglas

"Usually", after an Epic bubble top when your point 3 gets taken out, the market often goes into "crash mode".


Point A very possible, and then bounce.

But your point B top may be wishful thinking.


I highly doubt we get back above daily 900 other than perhaps a slight overthrow on a back test, once it is cracked hard.

This upcoming move is not an aberration that was "not supposed to happen" like the big Covid dip.

This should be the real deal transition into long term bear, with a long time spent below the daily 900.


So something along these lines might be best case for bounce if VIX explodes here and we do break down.

And also a possibility Covid lows come much faster than shown here, if market does indeed go into point of recognition crash mode...likely depends on how wide open they break Apple and Tesla when they finally do break wide open.


dow.png


The strength of Government lies in the people's ignorance, and the Government knows this, and will therefore always oppose true enlightenment. - Leo Tolstoy