Jump to content


Photo

Market at critical juncture: My FF is flat to DOWN, then UP


  • Please log in to reply
397 replies to this topic

#1 dTraderB

dTraderB

    Member

  • Traders-Talk User
  • 17,314 posts

Posted 20 February 2023 - 05:20 PM

I hold a partially hedged NET SHORT position but I had expected ES to be nearer to 4K or below on Friday.

But BULLS recovered from near 4050 and are battling the BEARS every point with ES now at 4076. 


Market is at a critical juncture with BEARS under more pressure after they could not press home the advantage on Friday. It is 

still a seasonally bearish period but unless BEARS can take this down to 4K soon the BULLS will rally to at least 4250. 


CHINA has not rallied as much as expected after reopening. 


#2 dTraderB

dTraderB

    Member

  • Traders-Talk User
  • 17,314 posts

Posted 20 February 2023 - 05:21 PM

NYSE closed today & short session for #ES_F (1pm close). Chop likely. Key support remains 4070-77 as posted and ES agreeing:
We hit 4075 overnight & have based above for 12hrs Plan today: As long as 4070 keeps holding, pop to 4090, 4105 in play. 4070 fails, sell starts to 4047
Quote Tweet


ZVBuToeP_mini.jpg
 
Adam Mancini
 
@AdamMancini4
·
Feb 18
Have a great weekend! All February, #ES_F has built a bull flag after a 300 point January rally. On Friday, it tested support. Make or break time now Plan next week: As long as 4070-77 holds, run to 4115, 4165 in play. 4070 fails, bulls dropped the ball & sell starts to 4035, 4k


#3 dTraderB

dTraderB

    Member

  • Traders-Talk User
  • 17,314 posts

Posted 20 February 2023 - 05:30 PM

FED QT finally affecting liquidity? 


HY Bond A-D Line Showing Liquidity Problem
 

hy_bond_a-d_line_feb2023.gif


February 17, 2023


https://www.mcoscill...uidity_problem/


#4 dTraderB

dTraderB

    Member

  • Traders-Talk User
  • 17,314 posts

Posted 20 February 2023 - 05:33 PM

Oscillator still in the 0 t0 MNUS 150 zone

I think it tests MINUS 250 then rises to the test the zero line


McClellanOsc_1493.gif

https://www.mcoscill...t_breadth_data/


FED QT finally affecting liquidity? 


HY Bond A-D Line Showing Liquidity Problem
 

hy_bond_a-d_line_feb2023.gif


February 17, 2023


https://www.mcoscill...uidity_problem/


#5 dTraderB

dTraderB

    Member

  • Traders-Talk User
  • 17,314 posts

Posted 20 February 2023 - 05:36 PM

Risk-free interest rates are now a genuine threat to equities.
The S&P earnings yield/US T-note spread is at its lowest since 2010, and the S&P dividend yield/1-year T-bill yield spread is at multi-year highs.
Full commentary now on the Market View tab of https://seabreezepartnerslp.com


#6 dTraderB

dTraderB

    Member

  • Traders-Talk User
  • 17,314 posts

Posted 20 February 2023 - 05:39 PM

I do not know if I posted this before... reposting:


Jerome Powell stated in his interview Tuesday that the Fed is not done hiking rates.
They should be, since they have already surpassed the 2-year T-Note yield.
Bad things happen to the economy when the Fed does that, e.g. Internet bubble collapse, 2007-08 GFC.


Risk-free interest rates are now a genuine threat to equities.
The S&P earnings yield/US T-note spread is at its lowest since 2010, and the S&P dividend yield/1-year T-bill yield spread is at multi-year highs.
Full commentary now on the Market View tab of https://seabreezepartnerslp.com


#7 dTraderB

dTraderB

    Member

  • Traders-Talk User
  • 17,314 posts

Posted 20 February 2023 - 05:48 PM

Just to remind myself and others: a RECESSION does not always produce a BEAR MARKET. In fact, a shallow recession can be VERY BULLISH if you do not buy too early or too late.. 

yeah, timing is everything. Scaling into LONGS from about midway in a recession can be very profitable. This RECESSION TALK now is almost irrelevant as far as trading the markets on a ST basis. 


Bulls Versus Economic Data That Says Fed Is Not Done

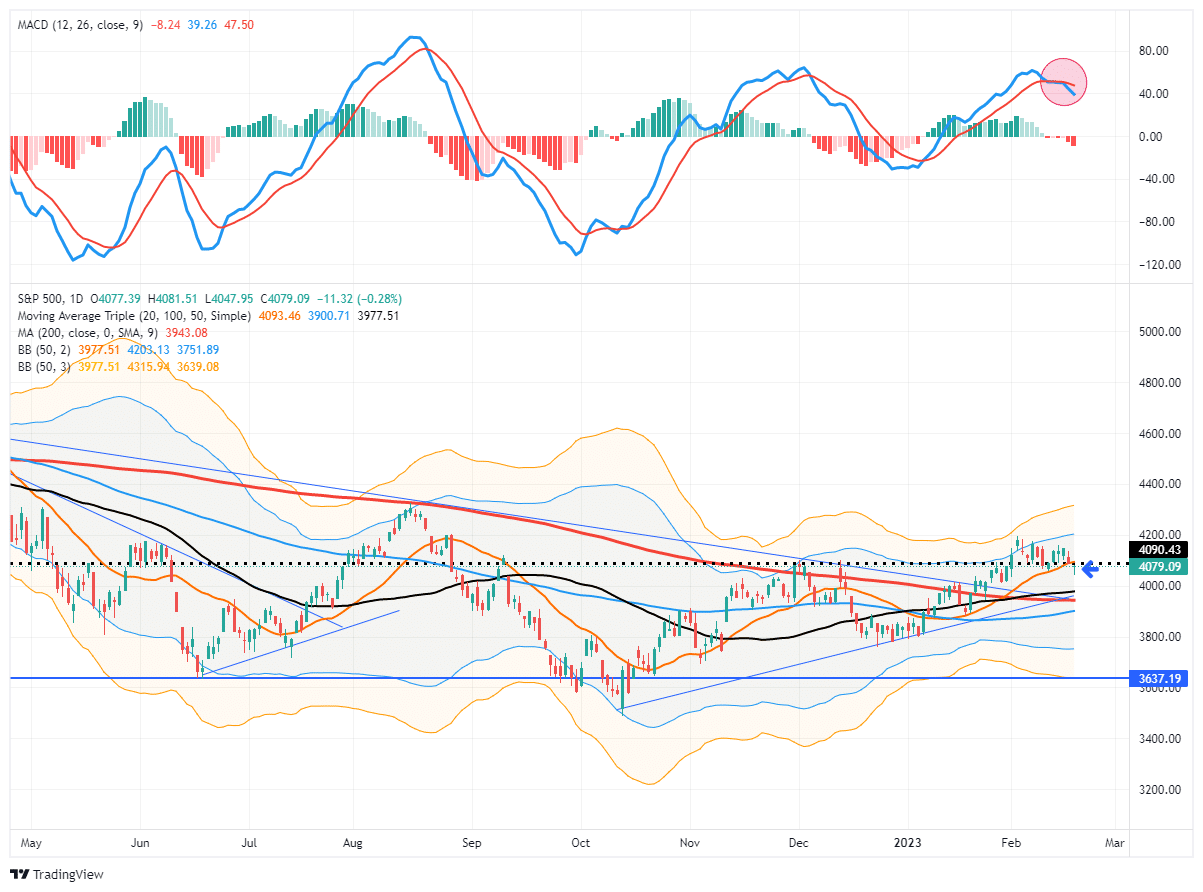
",,,,However, on Friday, the market cracked that initial support at the 20-DMA as the MACD signal deepened. While the market did rally into Friday’s close, suggesting the bullish bias remains, this is the first sign of a potential retest of the multiple support levels clustered around the 3950-4000. If the market can hold those levels, such will be an opportunity to increase equity exposure. A failure of that support will suggest a deeper correction is at work.

image-67-1024x759.png

As we will discuss in today’s newsletter, the economic data has supported the bullish case of a “no landing” scenario. That scenario assumes the economy avoids a recession entirely, allowing earnings to start growing again in the second half of the year. That somewhat optimistic scenario is heavily at odds with a Federal Reserve focused on slowing inflation which is only achieved by reducing economic demand through tighter monetary policy.

No Recession Bet Seems Unlikely

"...However, on Friday, the market cracked that initial support at the 20-DMA as the MACD signal deepened. While the market did rally into Friday’s close, suggesting the bullish bias remains, this is the first sign of a potential retest of the multiple support levels clustered around the 3950-4000. If the market can hold those levels, such will be an opportunity to increase equity exposure. A failure of that support will suggest a deeper correction is at work.

image-67-1024x759.png


,,,While markets are rallying short-term, history suggests that equities will not be able to fend off higher rates indefinitely. Such is particularly the case with the 2-year Treasury rate, which correlates with changes to Fed policy. It also suggests that interest servicing on consumer debt will become more problematic over the next several quarters as individuals run out of savings....."


#8 dTraderB

dTraderB

    Member

  • Traders-Talk User
  • 17,314 posts

Posted 20 February 2023 - 05:53 PM

Never heard of this before... very interesting from CARL:


The market is currently topping because the Silver Cross Index (SCI), which expresses intermediate-term participation, is overbought and topping. A Silver Cross is when the 20-EMA of a price index crosses up through the 50-EMA. The Silver Cross Index shows the percentage of stocks in a market or sector index that have a made a Silver Cross. The SCI currently has a reading of 75 percent, having fallen from a top of about 80.

CONCLUSION: Deterioration of participation (the SCI) is likely to cause further price decay in the intermediate-term, which will likely see stalled long-term participation (the GCI) begin to decline as well.


https://stockcharts....urrent-835.html


#9 dTraderB

dTraderB

    Member

  • Traders-Talk User
  • 17,314 posts

Posted 20 February 2023 - 05:55 PM

Are you unsure about who to listen to when it comes to equities?
Would you like me to simplify it for you in one simple equation?
US 6m risk-free yield 5% and UP
S&P 500 earning yield 5% DOWN
There’s nothing else to know This is worse ratio in over 20 y


#10 K Wave

K Wave

    Member

  • Traders-Talk User
  • 26,751 posts

Posted 20 February 2023 - 10:01 PM

Looking very Apexish on Dow hourly..


3 and 4 hour threatening rollover in unison....but have to have breakdown on hourly for that to happen...


Edited by K Wave, 20 February 2023 - 10:03 PM.

The strength of Government lies in the people's ignorance, and the Government knows this, and will therefore always oppose true enlightenment. - Leo Tolstoy