Jump to content


Photo

Turn Windows for the Week of September 21st


  • Please log in to reply
2 replies to this topic

#1 Douglas

Douglas

    Member

  • Traders-Talk User
  • 2,197 posts

Posted 19 September 2026 - 01:19 PM

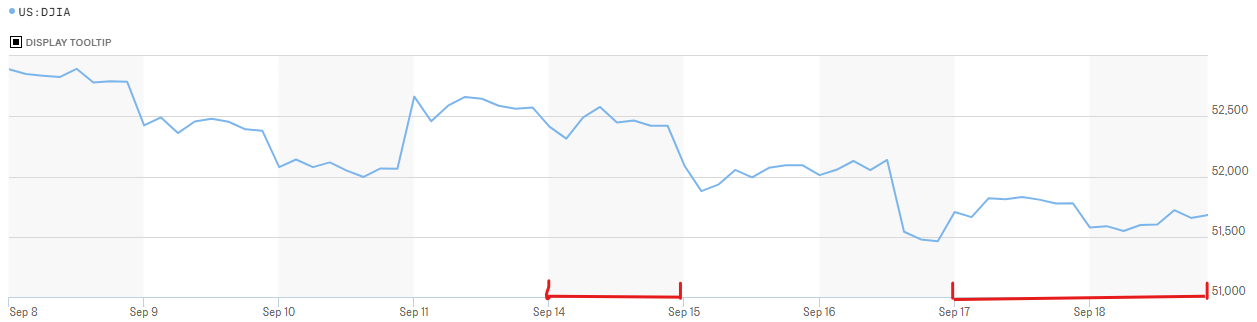
According to my turn probability summation system, the days this coming week with the highest likelihood of seeing a turn in or acceleration of the current trend in the DJIA are Monday September 21st and Friday the 25th.


Last week the Monday the 14th turn window caught the high for the week and part of a double top leading to a thousand DOW point sell off.  The Thursday and Friday turn window last week captured the rally out of a low in the relatively high summation value turn window wannabe on Wednesday which I noted in last week's post.
 

Sept-19-Hourly.png


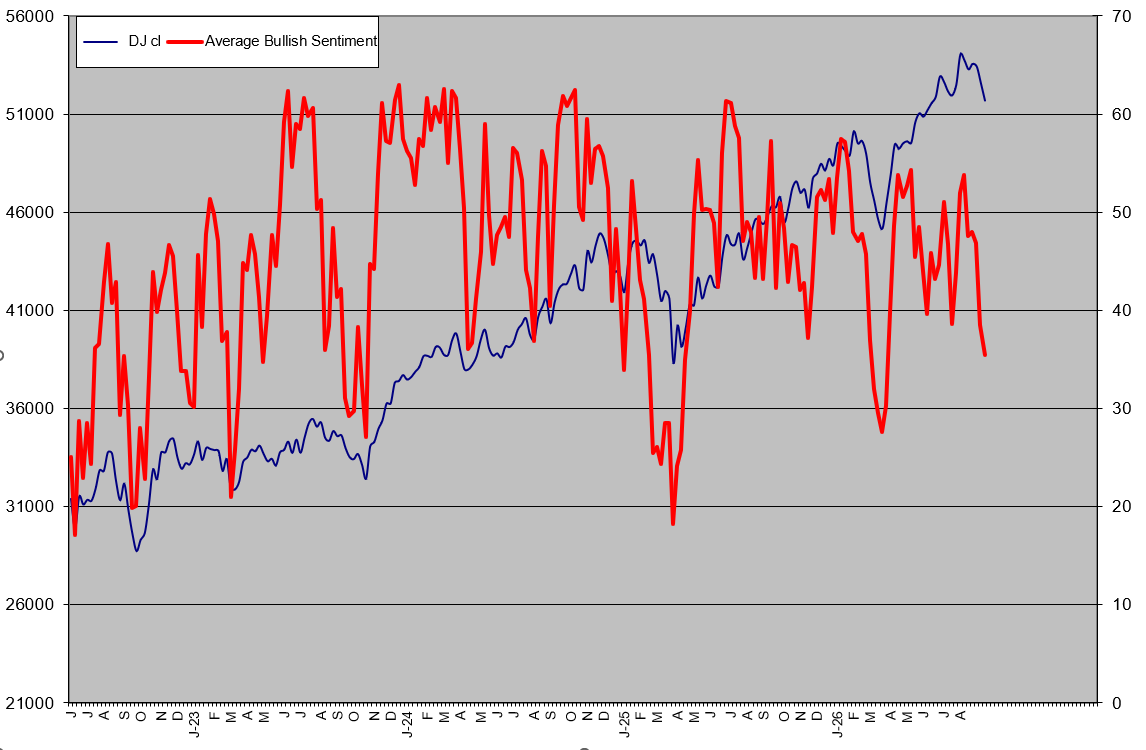
The stock market managed to muddle through last week's serious break risk with only a few dings.  The next high risk window falls in the first full week of October a few weeks from now.  Not sure what happens in the mean time, but sentiment surveys that I track as shown in the plot below have dropped sufficiently to spark a rally if the larger trend has not changed.
 

Sept-19-Avg-Bullish-Sent.png


The open mouth committee Fed heads hit the stump next week pontificating on what Kevin actually meant to say in his short speech at the presser last week.  I just wish one of them would explain how a quarter point hike in the overnight lending rate is going to fix the current inflation problem especially considering the Fed/Treasury amalgamation is still churning out debt funny money to the tune of more than five billion dollars every single day like there is no tomorrow.  


Regards,

Douglas


Edited by Douglas, 19 September 2026 - 01:21 PM.

#2 Douglas

Douglas

    Member

  • Traders-Talk User
  • 2,197 posts

Posted 19 September 2026 - 11:46 PM

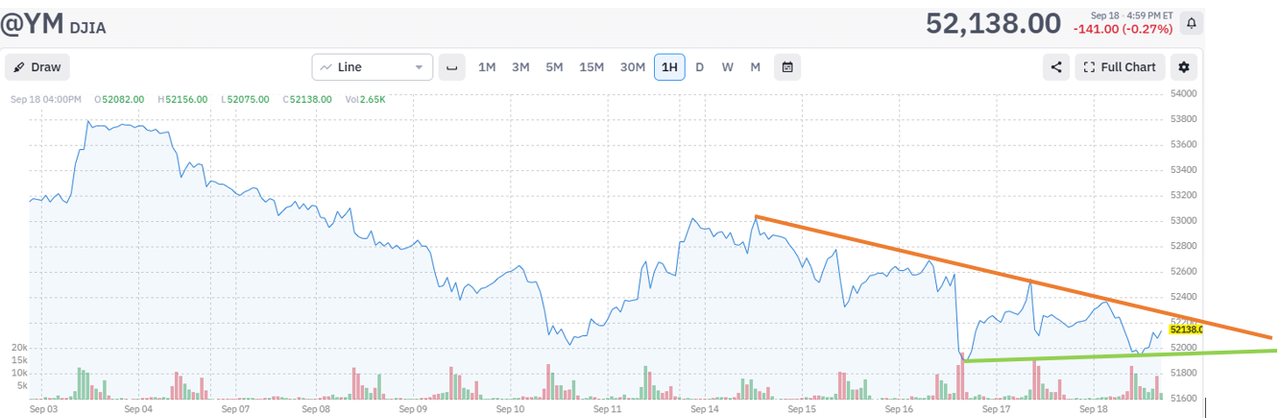
When the futures open later Sunday evening, a breakout of the triangle below in the YM DJIA future should provide a hint as to what direction the index will take in cash trading this coming Monday.  The triangle has both positive and negative features.  On the negative side, failing volume together with the red failing top line would appear to suggest a breakdown should be expected, but on the positive side, the lower green line would appear to be touching a double bottom projecting higher prices.  Given the down trend going into this current turn window, my summation system would appear to be projecting a turn up on Monday, but at this point an acceleration down also can't be ruled out just yet.  Oh well, we'll see soon enough. 


Sept-20-YM-Chart.png


Regards,

Douglas


#3 Douglas

Douglas

    Member

  • Traders-Talk User
  • 2,197 posts

Posted 21 September 2026 - 05:20 AM

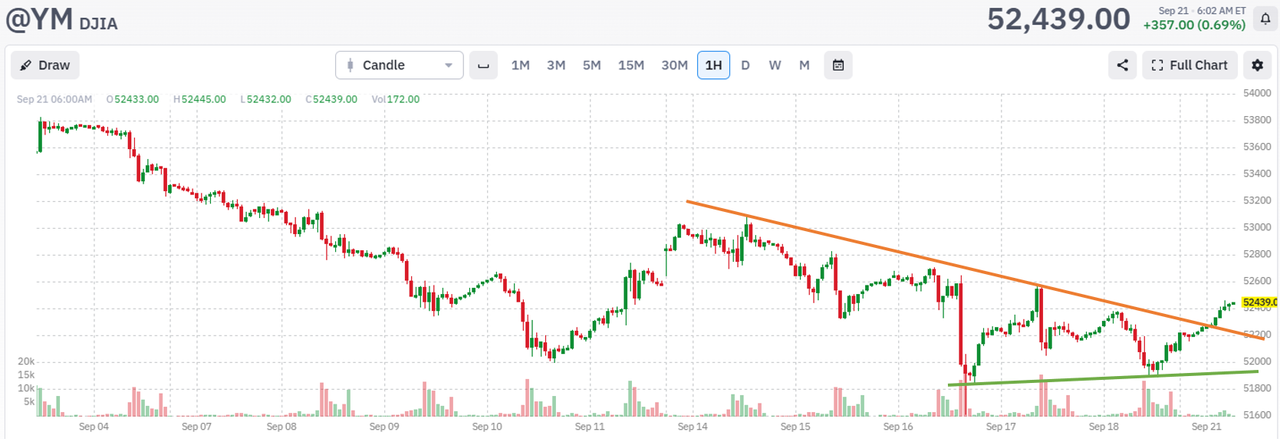
Soon enough has arrived and the verdict is higher with a top line breakout of the triangle.  How high is high?   Well, new all time highs can't be ruled out, but that will trash my EWave count, surprise, surprise.  More on that if the new high happens.  Meanwhile, buy the dip still rules the roost.


Sept-21-Triangle-in-DJIA.png


Regards,

Douglas