"TimerDigest" has "The Ord Oracle" ranked #8 in performance for six month timeframe for the S&P and #4 for 3 months ending 9/10/04.
For 30 to 90 days horizon: Long SPX (8/10/04) at 1079.04.
Short term trades, one day to one-week horizon: Flat.
We have "800" phone update that cost $2.00 a min. and billed to a credit card.Call (1-970-224-3981) for sign up. We update Eastern time at 9:45; 11:30; 1:30; 3:30 and4:00. Question? Call me (402) 486-0362.
What to expect now:
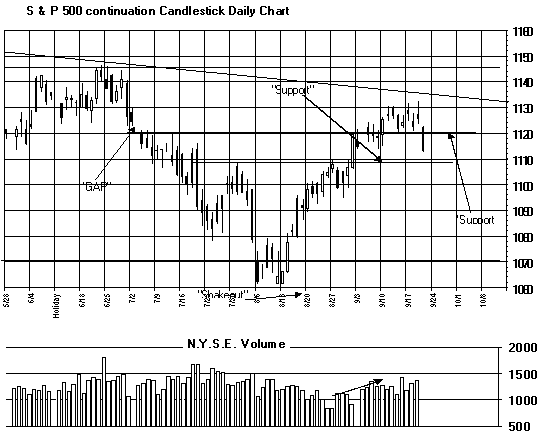
The S&P have started a consolidation. Today's volume was fairly good to the downsideand implies there is short term force to the downside. A gap formed between yesterday'sclose and today's open near the 1122 and may provide resistance. We are long the S&Pat 1079.04 and we may take profits on this position on a rally back to the 1122 range.There are several areas of support and the strongest area appears to come in near the 1109level which is the high on 8/2 and 8/27. If the 1109 level is tested on light volume, wemay end up with another buy signal at that level. The bigger trend is up and muchhigher prices will be seen. But for the near term expect a consolidation down near the1109 level.
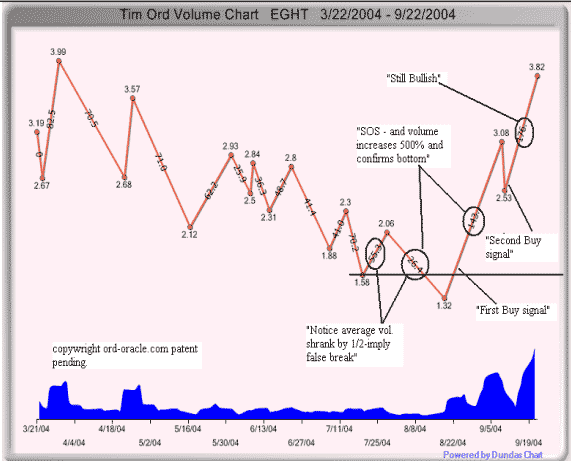
On today's report on the last page we have included a graph of "EGHT" in theformat of what I call "Ord-Volume". This graph depicts the ebb and flow ofvolume between swings and identifies the force in each swing. Notice how the averagevolume shrank in 1/2 as the EGHT move to a new low at 1.32. This condition implied a falsebreak to the downside. Notice the rally from the 1.32 low had the Ord-volume increasednearly 500% and confirmed a bottom. This formed a bullish "Sign of Strength".The first buy signal came on a close above the previous low at 1.58 and the second buysignal came at a close above 2.53. We are along at 2.62. You can see the current legup is pushing on average volume of 176 and implies this rally should continue. Moreexamples of "Ord-volume" can be see on my web site (ord-oracle.com). Thesoftware is near completion.
We sent out a special email report today (9/22/04) notifying that we bought NEXM at 1.33
We are long the SPX on 8/10 at 1079.04 and we are holding that position with a possibleshort term target to 1122. We hold LU at 3.45. We hold HPC at 13.73. We bought EGHT at2.62. Should go back to old high of 8.00 if not higher.
Nasdaq Composite:
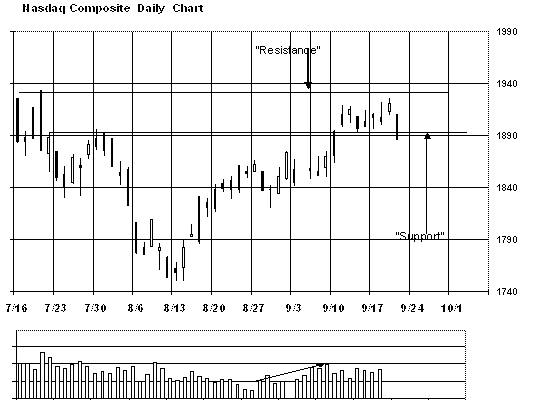
Today's volume to the downside was good and tested the previous low set on 9/15 on nearequal volume and implies the support at the 1890 level will be broken. The next lowersupport comes in near the 1870 and may be the place where a buy signal get triggered. Nosignal for the moment.
GOLD Market:
A gap formed from 9/20 to 9/21 between the price level of 93 to 94.5 on the XAU. Gaps arelike magnets and also are support areas. Therefore the bottom of the gap at the 93 levelshould hold any pull back. Volume was good yesterday on the XAU on the attempted breakoutabove the previous high at 96 but still lower than the day that high was recorded. Therefore, the XAU may back and fill and test the lower gap level near 93 and build"Causes" before another attempt to break out above the 96 level. The break abovethe 96 level should come fairly soon and that would imply the XAU should head to the nexttarget to 106.
We double our positions in BGO on (7/30/04) at 2.34 and we now have an average price at2.70. Long CBJ for an average of price of 2.89. CBJ is on a monthly buy signal from theMay low. Long NXG average of 2.26. NXG has support at 1.35. NXG is on a buy signal on themonthly chart that was triggered in May. We doubled our position in GSS on (7/30/04) at4.04 and we have an average price of 5.24. Long PMU at average 1.12.
The SuperHornets v2.0 Performance History was just updated to include its March trades.The system was off to a undesirable start but recovered very well during the recentdowntrend in the market returning our subscribers at rate of 165%per annum with NOLEVERAGE. You add leverage and the yield becomes phenomenal. Buy and Hold strategy is alsoincluded for comparison. Click here to see the trade by trade detail:
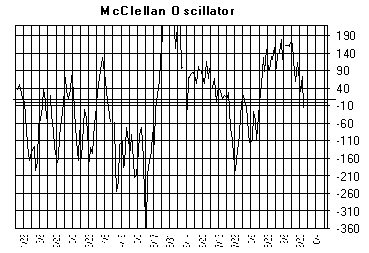
The McClellan Oscillator closed at -366 on May 10 and in an area where previousintermediate term lows has occurred. Today's close came in at -18 and neutral for theshort term.
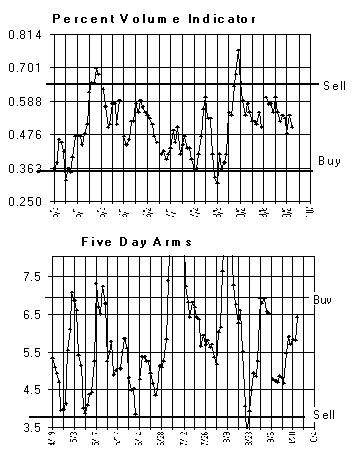
The “Percent Volume” Indicator closed at .50 and in neutral territory.
“Five day ARMS” indicator closed at 6.41 and in the bullish level.
Conclusion: Long SPX on 8/10/04 at 1079.04.
Longer Term Trend: Long SPX on 8/19/04 at 1091.23.
