Jump to content


Photo

A look at cumulative A-D


  • Please log in to reply
2 replies to this topic

#1 dcengr

dcengr

    Member

  • Traders-Talk User
  • 13,391 posts

Posted 26 December 2006 - 10:21 PM

I know I've discussed this before. But I got my hands on some historical cumulative A-D data, and decided to chart out some cases.

For those of you interested, you can get FREE cumulative A-D data from here:

Free A-D data

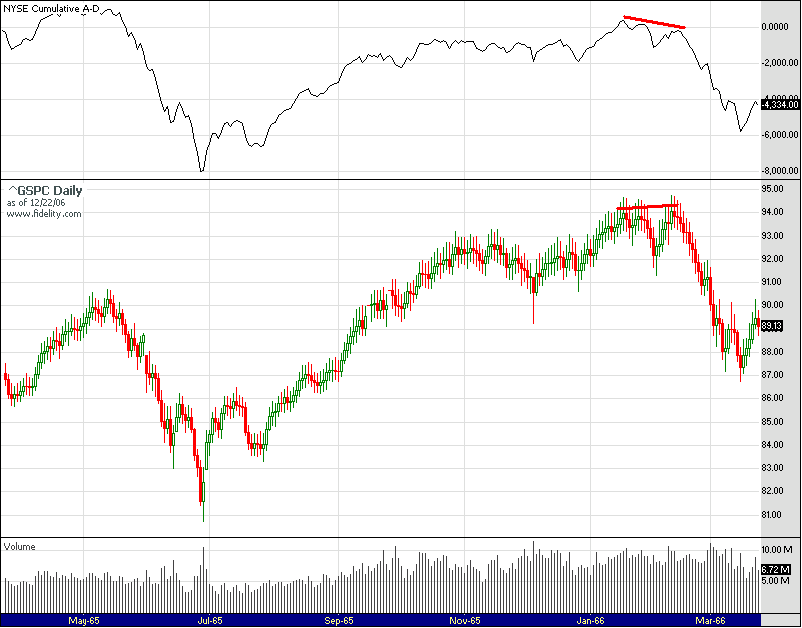
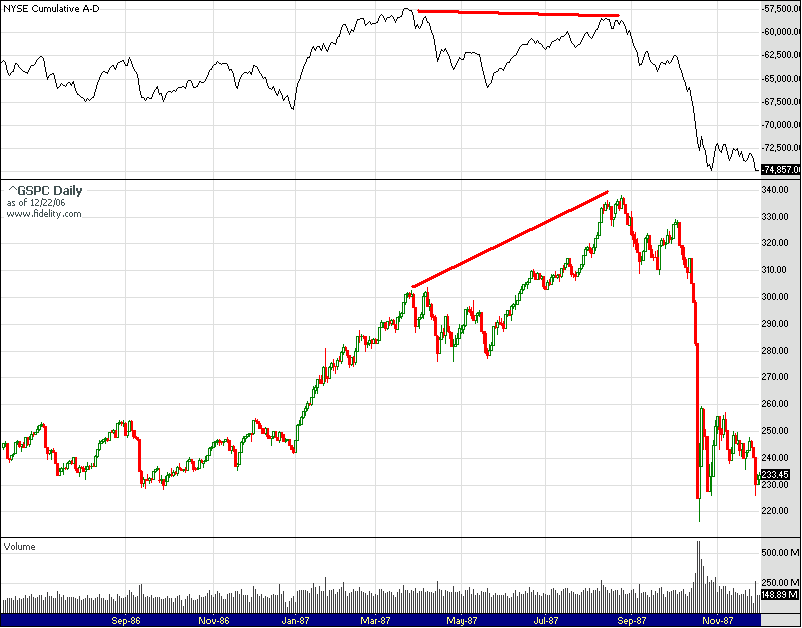
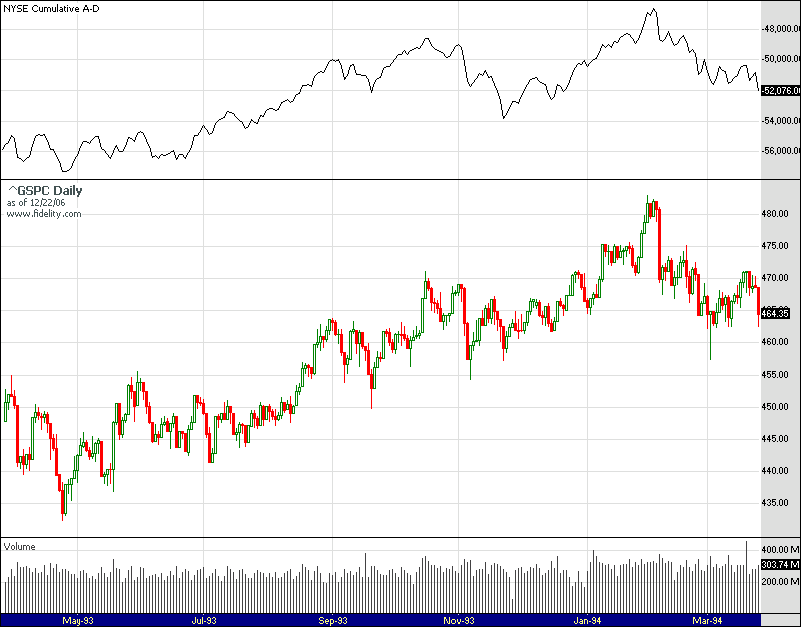
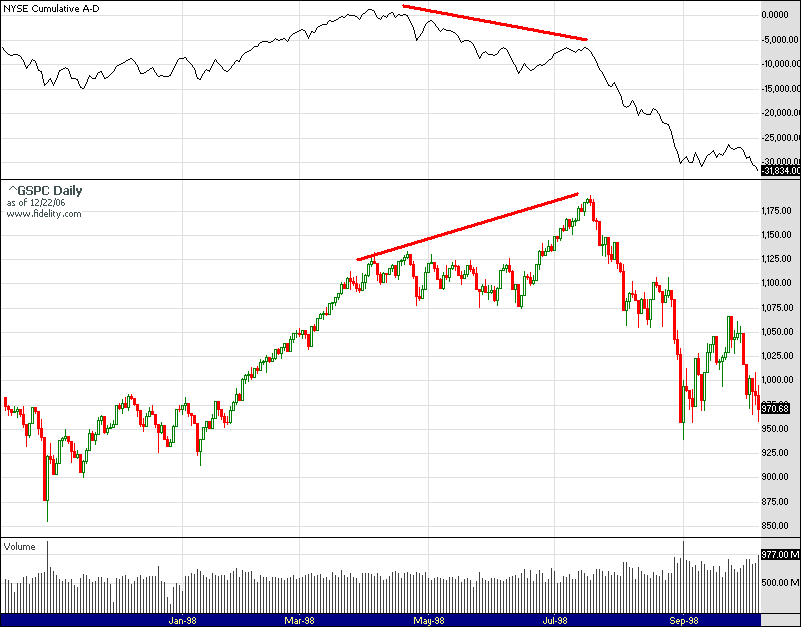
As I said before, I had constructed an S&P 500 ONLY cumulative A-D data, and compared it to the S&P. But since S&P components changed, I wasn't sure if the data was representative.

Now I have my hands on some historical cumulative A-D data for NYSE and decided to chart it against the S&P.

The cases I'm presenting are: 66, 87, 94, and 98. As you can see, in some cases, the cumulative A-D did show a divergence with price. In some cases, it did not. If an IT top is to be made here, or even a fast decline is to start here, there are historical precedence where they have been made without any signals given by cumulative A-D of NYSE issues.

Posted Image

Posted Image

Posted Image

Posted Image
Qui custodiet ipsos custodes?

#2 kaiser soze

kaiser soze

    Member

  • Traders-Talk User
  • 884 posts

Posted 27 December 2006 - 01:17 PM

Thanks for sharing the work. But the charts you display actually support the argument of the moneyflow theorists.

1994 appears to be the ony case where no divergence existed betwen price and cumuative A/D and it turned out to be a decline of less than 5 %. I also know there was a huge divergence in 2000 (beginning all the way from 1998 I think) between price and A/D.

The pattern before a top of any significance always appears to be a consolidation after a big run, then followed by a narrow blistering advance to new highs.


Speaking of A/D, did you see this monster divergence in India ?

Posted Image

Posted Image


I have been trying to find the A/D data for other emerging markets but have not been able to as yet. If you find the A/D data for Korea, Hong Kong, etc, please let me know. I think a possible implication for US markets is that US merely consolidates while other EMs begin full fledged bear markets. That would reverse mutual fund flows back into the US and provide fuel for the rally.

#3 dcengr

dcengr

    Member

  • Traders-Talk User
  • 13,391 posts

Posted 27 December 2006 - 04:33 PM

Thanks for sharing the work. But the charts you display actually support the argument of the moneyflow theorists.

1994 appears to be the ony case where no divergence existed betwen price and cumuative A/D and it turned out to be a decline of less than 5 %. I also know there was a huge divergence in 2000 (beginning all the way from 1998 I think) between price and A/D.

The pattern before a top of any significance always appears to be a consolidation after a big run, then followed by a narrow blistering advance to new highs.


Speaking of A/D, did you see this monster divergence in India ?

Posted Image

Posted Image


I have been trying to find the A/D data for other emerging markets but have not been able to as yet. If you find the A/D data for Korea, Hong Kong, etc, please let me know. I think a possible implication for US markets is that US merely consolidates while other EMs begin full fledged bear markets. That would reverse mutual fund flows back into the US and provide fuel for the rally.


What I noticed is that cumulative A-D is not such a great timing tool to pick the top within a week or even a month.

2000 is a great example of the cum A-D having topped years before.

However, I did notice that the MCSUM does have some warning before most declines. It appears a trend goes on quite without volatility for a while, then near an IT top, volatility increases, even if it continues to go up (ie up and down turning). This shows up on the McSum. When enough of this has occured, then the market goes up for the final high, then pukes.
Qui custodiet ipsos custodes?