Jump to content


Photo

Volatility of volatility revisited


  • Please log in to reply
3 replies to this topic

#1 kaiser soze

kaiser soze

    Member

  • Traders-Talk User
  • 884 posts

Posted 03 January 2007 - 05:20 PM

Posted Image

Posted Image


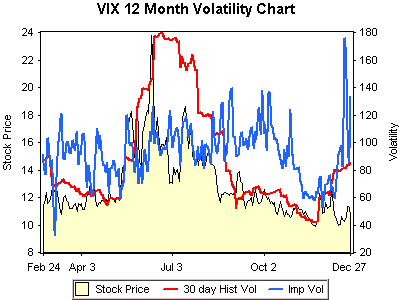
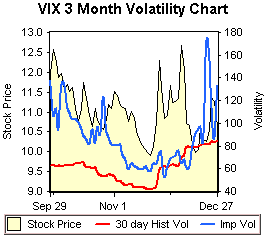
Just before the mid December mini-sell-off, the volatility of volatility began to spike while volatility itself was well-behaved. Now we have volatility of volatility spiking again while selected volatility indices most notably the QQV are spiking as well.

http://www.traders-t...?...c=64353&hl=

#2 dcengr

dcengr

    Member

  • Traders-Talk User
  • 13,391 posts

Posted 04 January 2007 - 12:43 AM

How is that volatility of volatility calculated? I seem to recall James doing something similar by doing some simple math routine on prices.. it wasn't a bad comparison to VIX. If I can get the formula, I can code it in wealthlab and see if there's a correlation to rise in volatility of volatility to future price action.
Qui custodiet ipsos custodes?

#3 kaiser soze

kaiser soze

    Member

  • Traders-Talk User
  • 884 posts

Posted 04 January 2007 - 01:02 AM

How is that volatility of volatility calculated? I seem to recall James doing something similar by doing some simple math routine on prices.. it wasn't a bad comparison to VIX.

If I can get the formula, I can code it in wealthlab and see if there's a correlation to rise in volatility of volatility to future price action.


I get the volatility information from my broker (OptionsXpress), who gets it from ivolatility.com.

Now, Optionsxpress provides this chart of historical and implied volatility overlaid with price for every security for which options are traded and the exact same methodology is used.

The historical volatility is calculated as for any security. It generally involves a formula of the type :
HV = square root of (250 * variance of natural log differences in daily closing prices)
Also see http://www.aspenres....Volatility.html
and http://www.montegoda...HSM/histVol.htm

The implied volatility is calulated by a weighted average of the implied volatilities (Black Scholes) of several near the money options close to expiration. Closer the strike is to spot and closer the expiration, higher the weightage. They blend the prices to ensure that the result is statistically consistent with time. The actual formula is proprietary to IV.com.
#4 dcengr

dcengr

    Member

  • Traders-Talk User
  • 13,391 posts

Posted 04 January 2007 - 09:59 AM

How is that volatility of volatility calculated? I seem to recall James doing something similar by doing some simple math routine on prices.. it wasn't a bad comparison to VIX.

If I can get the formula, I can code it in wealthlab and see if there's a correlation to rise in volatility of volatility to future price action.


I get the volatility information from my broker (OptionsXpress), who gets it from ivolatility.com.

Now, Optionsxpress provides this chart of historical and implied volatility overlaid with price for every security for which options are traded and the exact same methodology is used.

The historical volatility is calculated as for any security. It generally involves a formula of the type :
HV = square root of (250 * variance of natural log differences in daily closing prices)
Also see http://www.aspenres....Volatility.html
and http://www.montegoda...HSM/histVol.htm

The implied volatility is calulated by a weighted average of the implied volatilities (Black Scholes) of several near the money options close to expiration. Closer the strike is to spot and closer the expiration, higher the weightage. They blend the prices to ensure that the result is statistically consistent with time. The actual formula is proprietary to IV.com.


VIX calculation isn't applicable here. I think James Quillian did something using the range of the prices.. I can't recall. But it seemed at least interesting to apply to other things.
Qui custodiet ipsos custodes?