Jump to content


Photo

Continuing the discussion related to advancing stocks vs indices


  • Please log in to reply
4 replies to this topic

#1 dcengr

dcengr

    Member

  • Traders-Talk User
  • 13,391 posts

Posted 21 January 2007 - 02:07 PM

First let me say I'll present the way these charts are created, but will not provide my own observations on them. I welcome feedback to whatever people think they see in it (though my previous posts may bias views).

The value I call the SPXP and NDXP are created by taking the cumulative sum of the percentage gain of each stock in the index.

For instance, for the NDX, there are 100 stocks. The percent gain is (today's close - previous day's close)/previous day's close. This is repeated for each stock in the index, then summed up. Hence its an equal price weighted index.

The QQQQ/NDXP is merely as it states, a division of QQQQ/NDXP, and RSI14 is the RSI14 of that ratio. The bars are colored red if it exceeds 70.
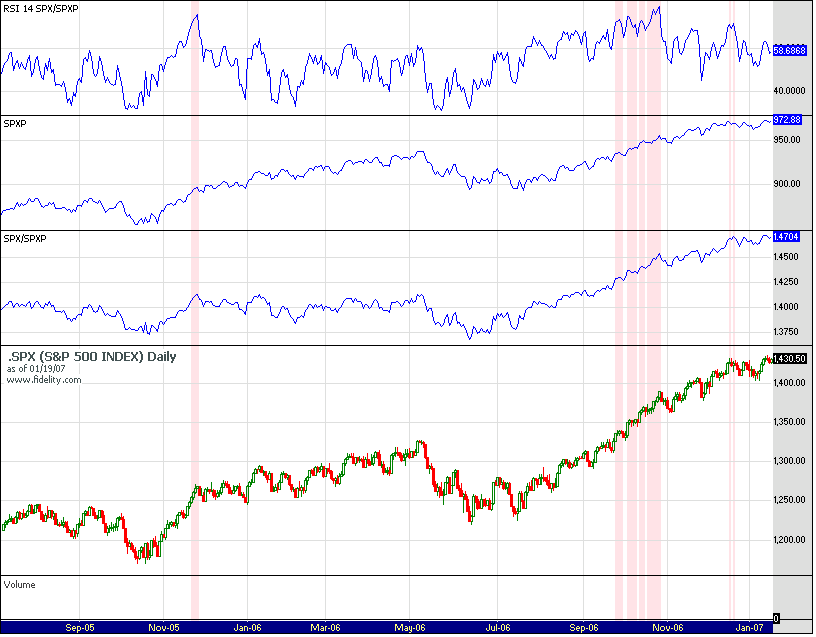
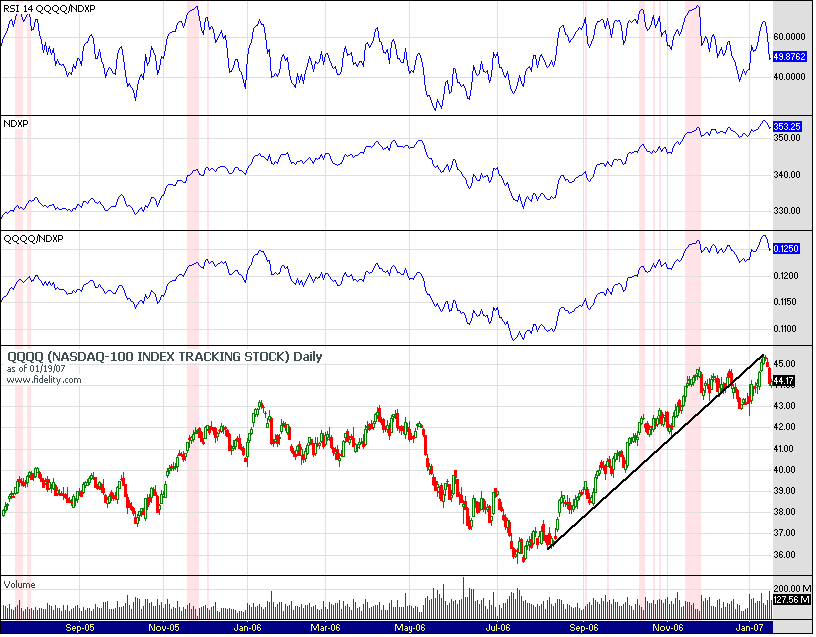
Posted Image

Posted Image
Qui custodiet ipsos custodes?

#2 Caduceus

Caduceus

    Member

  • Traders-Talk User
  • 230 posts

Posted 21 January 2007 - 02:49 PM

Nice charts, I have taken the liberty to mark them up a little. I see some gross divergences which in the past have led to some sice tradable declines. The fly in the ointment is that the NYAD is at an all time high. In the other instances the NYAD was near a high relative to its recent pattern or double topping (Possibly splitting hairs here). I have taken some short positions in semis, techs, and midcaps as a result (at the open on Friday) for an IT trade. I would not be suprised to see a retest of the high in the NDX or nominal new highs. Beyond that I will have to cover. I will trade what the market suggests but I am not expecting to go long for the IT for some time. [attachment=5190:attachment] [attachment=5191:attachment] Regards, C

#3 Caduceus

Caduceus

    Member

  • Traders-Talk User
  • 230 posts

Posted 21 January 2007 - 03:28 PM

Another fly in the ointment for the bearish case relating to indices and stocks making new highs is that a large number of Dow components were making new highs or very close to making new highs earlier this week when the Dow closed at an all time high. I remember someone doing a study of this some time ago,(Jason Goepfert, Mortiz?) I can't remember who. At the time the dow was making a new 52 week high with only 5 stock also making a 52 week high. This obviously tended to indicate a weak foundation for further rally. Earlier this week we had about 15 stocks in the Dow either making a new 52 week high or very close to making a 52 week high. I am not sure how much this adds to the discussion. I guess I am just looking for reasons I could be wrong given that I am bearish. :bear:

#4 dcengr

dcengr

    Member

  • Traders-Talk User
  • 13,391 posts

Posted 21 January 2007 - 03:44 PM

Another fly in the ointment for the bearish case relating to indices and stocks making new highs is that a large number of Dow components were making new highs or very close to making new highs earlier this week when the Dow closed at an all time high. I remember someone doing a study of this some time ago,(Jason Goepfert, Mortiz?) I can't remember who. At the time the dow was making a new 52 week high with only 5 stock also making a 52 week high. This obviously tended to indicate a weak foundation for further rally. Earlier this week we had about 15 stocks in the Dow either making a new 52 week high or very close to making a 52 week high.

I am not sure how much this adds to the discussion. I guess I am just looking for reasons I could be wrong given that I am bearish. :bear:


You are referring to this chart...

Yes someone made references to it.. I believe it was Dr. Eldar?

http://stockcharts.com/c-sc/sc?s=$NYHL&p=D&yr=3&mn=0&dy=0&i=p18674852194&a=94893892&r=6802.png
Qui custodiet ipsos custodes?

#5 Caduceus

Caduceus

    Member

  • Traders-Talk User
  • 230 posts

Posted 21 January 2007 - 04:06 PM

That chart is similar to the chart I was asking Airdale about in one of your prior posts. It is working with the same concept but the stats (which I don't have) and study I was referring to relates to the Dow and it's components. Regards, C