
$SPX Hurst Analysis
Started by
SilentOne
, Jul 09 2008 09:22 PM
67 replies to this topic
#11

SilentOne
-
- Traders-Talk User
- 3,452 posts
Member
Posted 07 March 2009 - 11:20 PM
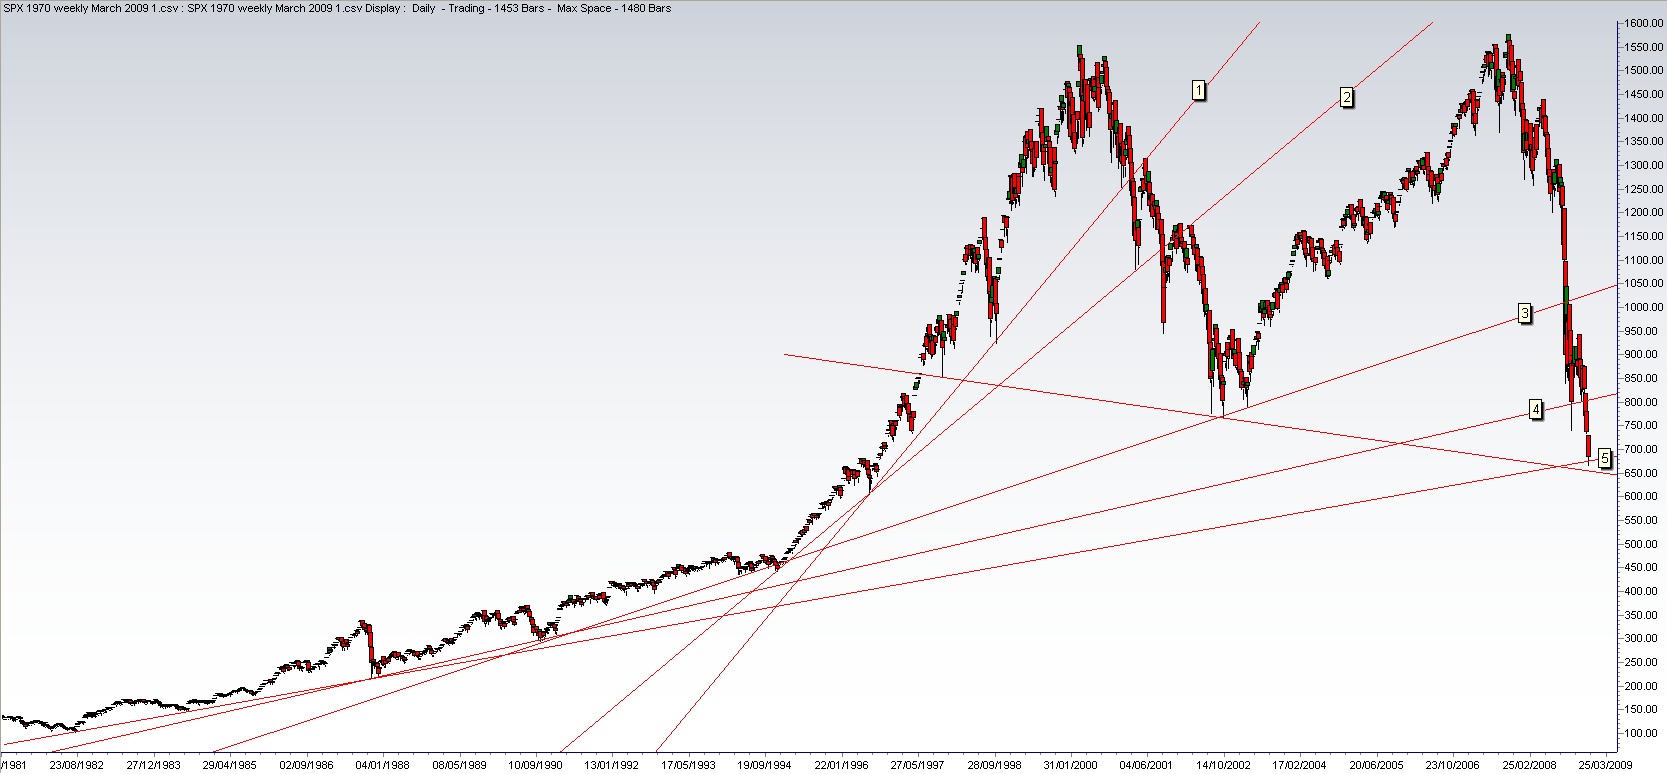
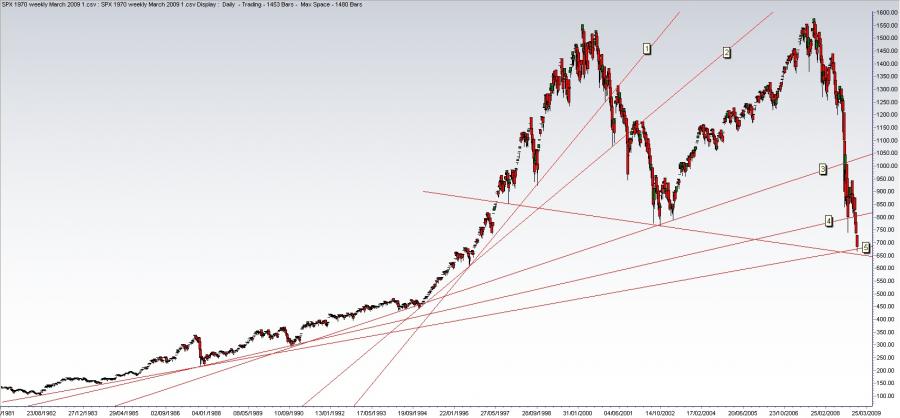
This was the 81st week off the Aug. 2007 low. The last nine 80 week cycle periods averaged 77.3 weeks, the longest among them was 80 weeks. In the period following the '87 crash, there were two 80 week cycles that ran longer.
This will be my last post for a while.
cheers,
john
"By the Law of Periodical Repetition, everything which has happened once must happen again and again and again-and not capriciously, but at regular periods, and each thing in its own period, not another's, and each obeying its own law ..." - Mark Twain
#12
Echo
-

- Traders-Talk User
- 2,273 posts
Member
Posted 08 March 2009 - 01:20 AM
Hi John,
You've spent a lot of time and effort on some elegant charts posted to this board, much appreciated. With regards to earlier posts on this thread, you seem to be following Bob's phasing and that is the one that makes the most sense to me as well. Bob defended his phasing against alternate phasings offered by others quite cogently and I have been not heard compelling agruments otherwise.
So you may find it interesting that these are the seven Hurst 4.5 year lows according to Bob (I'm not sure if this was a personal communication or a previous post):
Aug 1982
Sept 1986
Oct 1990
April 1994 (1st week, only 42 months)
Oct 1998
March 2003
August 2007
He argued that the 1987 crash was a cycle straddle.
The relevance of this is that you would end up reconfiguring your 80wk lows and would not have the 87 and 89 wk long ones. 81wks is the longest since 1982, fitting as this is the largest swiftest drop since then.
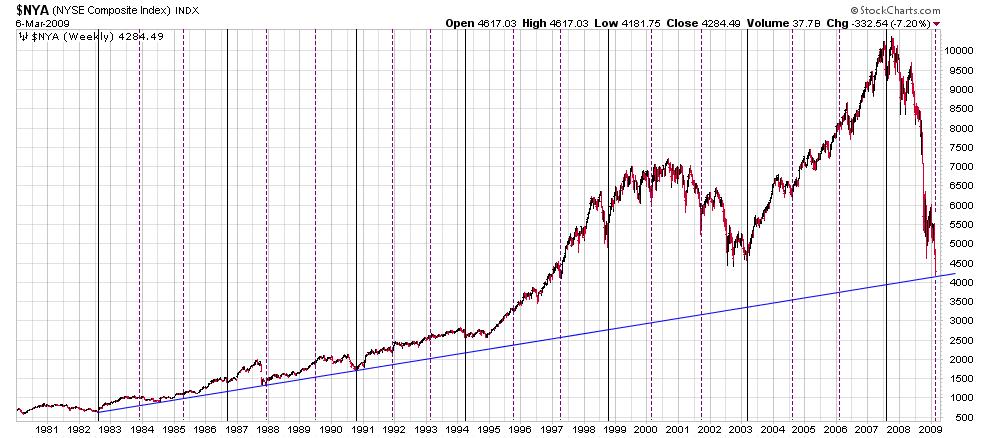
Here is a linear chart of the NYA with the 4.5yr lows in black and the 80 wk lows in purple. The 80wk lows before 1994 are not necessarily Bob's, but where I have placed them visually. Also note that the bounce on Friday, yesterday March 6 2009, came right off the 27 year trendline going back to 1982 with 4 and now 5 valid touchpoints. This is also the turn date you mentioned in your Feb 2 post. I think the evidence strongly favors the 80wk low to have been this Friday.
http://stockcharts.com/h-sc/ui?s=$NYA...&listNum=10
If we can't get a rally starting this week, I think this bodes very poorly for the long term future...
Echo/Slinky
You've spent a lot of time and effort on some elegant charts posted to this board, much appreciated. With regards to earlier posts on this thread, you seem to be following Bob's phasing and that is the one that makes the most sense to me as well. Bob defended his phasing against alternate phasings offered by others quite cogently and I have been not heard compelling agruments otherwise.
So you may find it interesting that these are the seven Hurst 4.5 year lows according to Bob (I'm not sure if this was a personal communication or a previous post):
Aug 1982
Sept 1986
Oct 1990
April 1994 (1st week, only 42 months)
Oct 1998
March 2003
August 2007
He argued that the 1987 crash was a cycle straddle.
The relevance of this is that you would end up reconfiguring your 80wk lows and would not have the 87 and 89 wk long ones. 81wks is the longest since 1982, fitting as this is the largest swiftest drop since then.
Here is a linear chart of the NYA with the 4.5yr lows in black and the 80 wk lows in purple. The 80wk lows before 1994 are not necessarily Bob's, but where I have placed them visually. Also note that the bounce on Friday, yesterday March 6 2009, came right off the 27 year trendline going back to 1982 with 4 and now 5 valid touchpoints. This is also the turn date you mentioned in your Feb 2 post. I think the evidence strongly favors the 80wk low to have been this Friday.
http://stockcharts.com/h-sc/ui?s=$NYA...&listNum=10
If we can't get a rally starting this week, I think this bodes very poorly for the long term future...
Echo/Slinky
Attached Thumbnails
#13
GOOSE
-

- Traders-Talk User
- 50 posts
Member
Posted 13 March 2009 - 07:24 PM
Hi John, if Aug 07 was the 4.5 year low for the SPX and we have pretty much headed down since then does that mean we probably won't end this bear market until the next 4.5 year low in 2012? I'm just trying to figure this out, I thought after a big cycle like that you would head up for a couple of years. I'm sure all this will make sense to me one day. Still struggling along on the course, I'm just half way through lesson two. I thought I might go blind counting the days for the FLD's.
Thanks
#14
Echo
-
- Traders-Talk User
- 2,273 posts
Member
Posted 14 March 2009 - 07:03 PM
Not John, but I'll put my 2 cents in.
Normally you would be correct that with a severely left translated 80wk cycle off the 4.5yr low, we should keep going down into the next 4.5 yr low in 1012. But what has happened here with this decline is anything but normal and certainly not only influenced by cyclical action. This is what Hurst referred to as a pseudotrend--a powerful fundamental influence that overrides the normal cyclical action. How do I know that? The last 4.5yr cycle from the 2003 lows was severely RIGHT translated and looked powerfully bullish. Hitting a top just a few months after the 4.5yr low August 2007 suggests that SOMETHING BIG HAPPENED--we now know what that is. Once this fundamental influence abates, the natural underlying cyclical action could cause a kind of snapback rebound in the markets. If this were to occur, the next 4.5yr low could actually end up at much higher price levels than today. This, of course, assumes that the fundamental influence of the current financial crisis does abate and without larger longlasting effects.
This is how I look at it.
Echo
#15
SilentOne
-
- Traders-Talk User
- 3,452 posts
Member
Posted 14 March 2009 - 11:28 PM
echo/slinky,
Thanks for that. I have struggled with the $SPX cycles picture for some time as I am sure have others. You have summarized how I look at it as well. It pretty much says that anything can happen here. There is no way to know.
The barometer I will now use is a hard asset like crude oil. Gold less so, but it may already be foretelling what is to come. What oil does going forward into the next 88/90 week cycle will tell me if we get continued deflation or something of a hyperinflation that we have not seen in a long time.
I'll say again. There is no way to know. One day and one week at a time.
cheers,
john
Edited by SilentOne, 14 March 2009 - 11:30 PM.
"By the Law of Periodical Repetition, everything which has happened once must happen again and again and again-and not capriciously, but at regular periods, and each thing in its own period, not another's, and each obeying its own law ..." - Mark Twain
#16
SilentOne
-
- Traders-Talk User
- 3,452 posts
Member
Posted 25 March 2009 - 09:06 PM
So what happened today? We likely put in a 12/14 day (2.5 week) Hurst cycle low.
Let me go back and link a post I made regarding the 80 week low that was likely to occur.
$SPX 80 week lows, 82nd week off the Aug. 2007 low
So as stated then, we are up for a minimum of 7 - 8 weeks and possibly longer, and along the way we are generating higher targets with each passing week. Sounds like a major bear market rally to me. Know this for what it is.
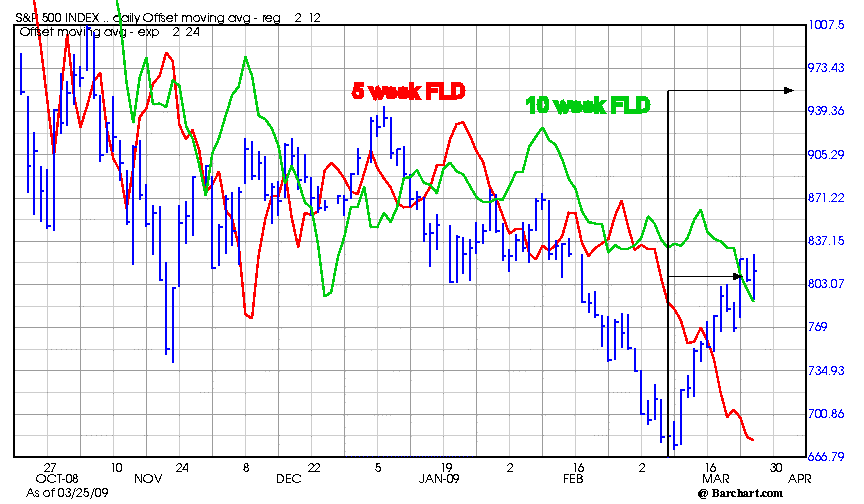
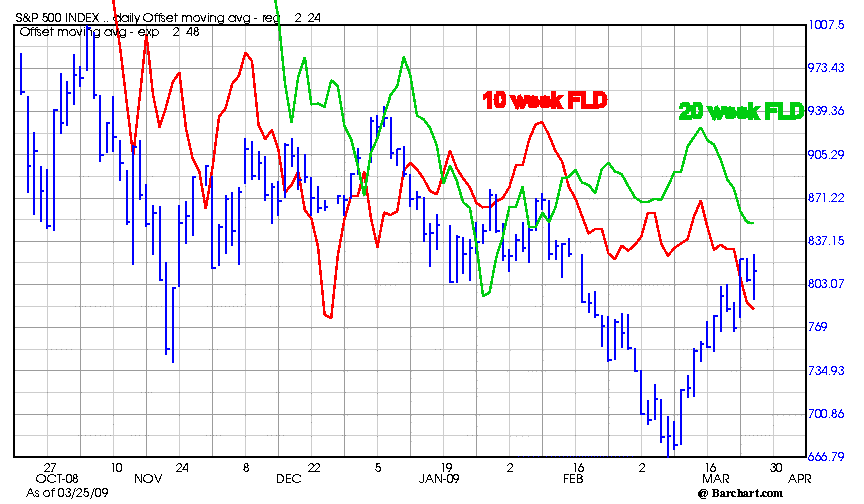
Now given that view and the fact that we are likely to climb a minimum 7 - 8 weeks and possibly more, here are the FLD targets that have been generated thus far. Also note the cascade position of the FLDs and how they are stacked so that one target in one timeframe generates a higher target in the next larger timeframe.
The 2.5 week FLD was easily met at $SPX 775.
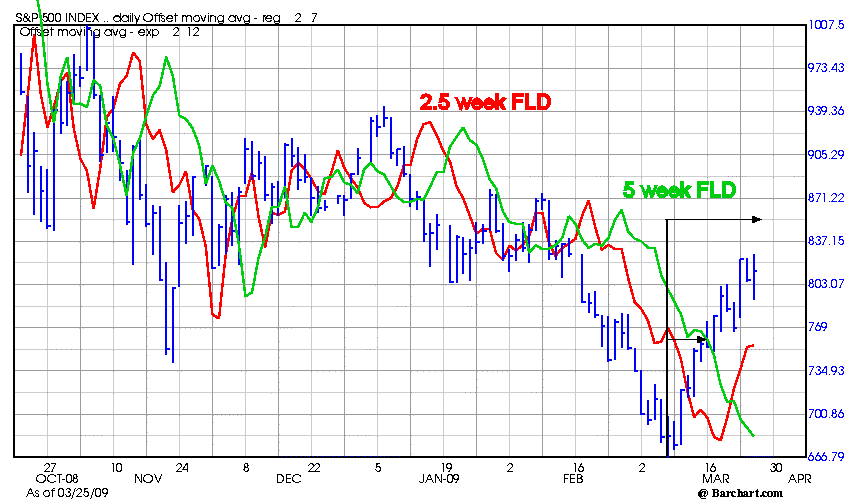
The 5 week FLD target (above) is approx. $SPX 855 and this should occur within the next week to 10 days or so.

A 10 week FLD target (above) was generated as well targeting $SPX 950 - 960. This should occur within the current 10 week cycle and possibly by late April some time. The 20 week is also coming into play but let's worry about that when we get there.

cheers,
john
Today was a 12/14 day (2.5 week) Hurst cycle low. If you hesitated, you likely missed the best buy for that low, same as the 3/4 day low that tested $SPX 705 and the 7 day (1.25 week) cycle low that tested 745. One can argue that Friday's low was a 12/14 day low, but it was quite early.
Let me go back and link a post I made regarding the 80 week low that was likely to occur.
$SPX 80 week lows, 82nd week off the Aug. 2007 low
So as stated then, we are up for a minimum of 7 - 8 weeks and possibly longer, and along the way we are generating higher targets with each passing week. Sounds like a major bear market rally to me. Know this for what it is.
Now given that view and the fact that we are likely to climb a minimum 7 - 8 weeks and possibly more, here are the FLD targets that have been generated thus far. Also note the cascade position of the FLDs and how they are stacked so that one target in one timeframe generates a higher target in the next larger timeframe.
The 2.5 week FLD was easily met at $SPX 775.

The 5 week FLD target (above) is approx. $SPX 855 and this should occur within the next week to 10 days or so.
A 10 week FLD target (above) was generated as well targeting $SPX 950 - 960. This should occur within the current 10 week cycle and possibly by late April some time. The 20 week is also coming into play but let's worry about that when we get there.
cheers,
john
Edited by SilentOne, 25 March 2009 - 09:15 PM.
"By the Law of Periodical Repetition, everything which has happened once must happen again and again and again-and not capriciously, but at regular periods, and each thing in its own period, not another's, and each obeying its own law ..." - Mark Twain
#17
SilentOne
-
- Traders-Talk User
- 3,452 posts
Member
Posted 02 April 2009 - 08:50 AM
Went flat here as I have no confidence in the equity markets and what they are doing. We could get a distribution top here into tomorrow, but then a 5 week low is due next week. We have an outstanding target of 855 on the $SPX for the current 5 week cycle (which is in its 20th day), which could well be achieved. I am not sticking around to find out.
cheers,
john
Edited by SilentOne, 02 April 2009 - 08:52 AM.
"By the Law of Periodical Repetition, everything which has happened once must happen again and again and again-and not capriciously, but at regular periods, and each thing in its own period, not another's, and each obeying its own law ..." - Mark Twain
#18
SilentOne
-
- Traders-Talk User
- 3,452 posts
Member
Posted 14 May 2009 - 10:25 AM
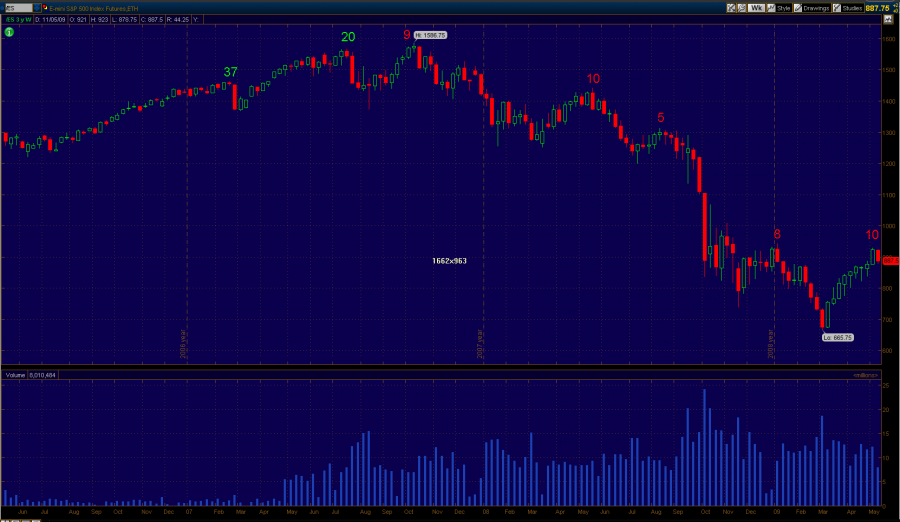
Well we had a good rally. I'll call it a bear rally until we see a change in character of the markets. By that I mean an ability for the market to rally longer than 10 weeks.
For example, in May last year the $SPX registered a top into the 10 week cycle low. A failure to put in a cycle low at that point and rally higher was a failure and bearish. I was surprised to see that happen at the time.
The same occured in August last year when the $SPX rallied out of the July low but could not put in a 5 week low that held. Another failure. This time I was looking for it and became extremely bearish as a result.
In January this year, the $SPX topped out after 8 weeks of rally. The 10 week low that came in mid-Jan. failed once again.
Now we have had a solid rally out of an 18 month low. This market needs to find a 10 week low here or it will fail once again and we have to wait for the summer to see where things settle. Because we are coming out of an 18 month low, the market should hold water for a longer period of time. But the first sign of a change has to be a new high after a 10 week low.
From the chart you can see it is quite clear what happens in strong bear trends. A market has to rally beyond its 10 week cycle at a minimum. Until this occurs, everything is suspect.
There was a great President who once said:
"There's an old saying in Tennessee I know it's in Texas, probably in Tennessee that says, fool me once, shame on shame on you. Fool me you can't get fooled again."  cheers,
john
cheers,
john
cheers,
john

Edited by SilentOne, 14 May 2009 - 10:35 AM.
"By the Law of Periodical Repetition, everything which has happened once must happen again and again and again-and not capriciously, but at regular periods, and each thing in its own period, not another's, and each obeying its own law ..." - Mark Twain
#19
SilentOne
-
- Traders-Talk User
- 3,452 posts
Member
Posted 12 July 2009 - 02:26 PM
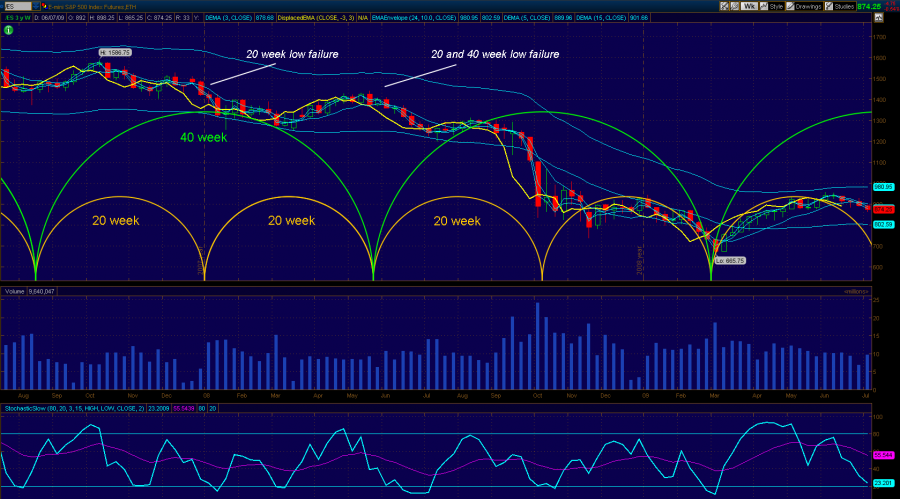
I've throw up a nominal 20 week cycle here against the last full 80 week cycle and beyond. I've noted the bearish failures that occured last year. I should also mention that the $SPX rallied 14 weeks out of this year's March low which was the longest rally since August 2007 (the last 80 week cycle low and 4.5 year Hurst cycle low).
While I'm not bullish, I'm not extremely bearish near term either. I think the $SPX is stuck in a range until later this year when it will break down into a 40 week cycle low. From there one can play another brief rally, but 2010 will likely be bearish until the next 80 week low (18 month) arrives in August 2010.
Trading the equity market from here on will be for dedicated traders IMO. I'll be playing major cycle lows (40 week or greater) and looking for shorts only as the $SPX reaches later into the 40 week cycles.
cheers,
john

Edited by SilentOne, 12 July 2009 - 02:30 PM.
"By the Law of Periodical Repetition, everything which has happened once must happen again and again and again-and not capriciously, but at regular periods, and each thing in its own period, not another's, and each obeying its own law ..." - Mark Twain
#20
Echo
-
- Traders-Talk User
- 2,273 posts
Member
Posted 12 July 2009 - 03:49 PM
John,
Out of curiosity, do you have a particular date or range for the equities 20wk low and what does your work show for a target low for say the SPX?
Echo


