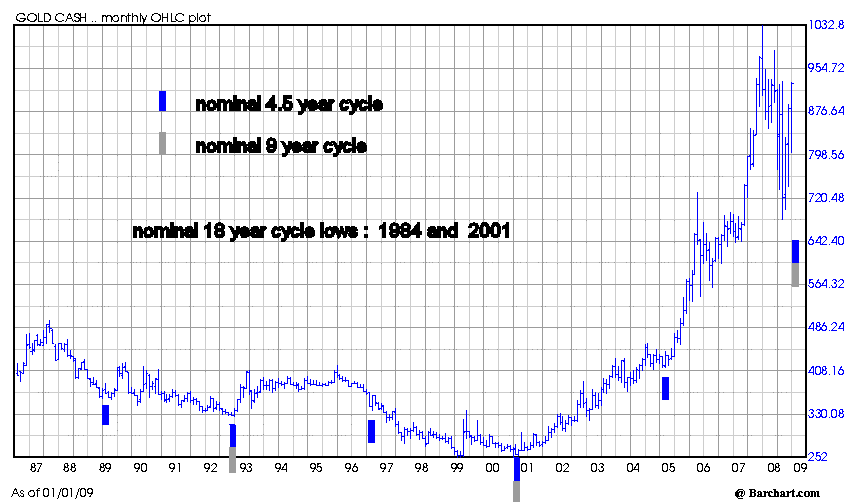
Here is an interesting phasing on gold. This was published Jan. 2007 and was a very good predictor for the market looking for a Summer 2007 low (so was I), and a high in early 2008. The thing worth noting is the status for the larger cycles (red and blue waves). The red wave approximates the 4.5 year Hurst cycle and the blue the 112 week cycle (or half cycle of the 4.5 year). The 4.5 year cycle is heading into a low due next year. The 112 week cycle is topping out as the 56 week cycle is setting its low. So of these three important cycles, we have the 4.5 year heading down, the 112 week (2.2 year) heading down. It is the 56 week cycle that has bottomed and is exerting upward pressure that we see right now.
timingsolutions
I explained in the previous post my dilemma for investing in gold at this time. With the 9 year and 4.5 year cycles due next year, will gold put in a lower or higher low. I don't really know. But certainly the best buys/bottoms have come off the bottoms or nest of lows involving the 4.5 year cycle and the 112 week cycle (2.2 year). These occured in 2001 and 2005. The secondary buys/bottoms have come when the 112 week cycle low comes in as the 4.5 year cycle is cresting. These occured in 2003 and 2007. The next due date in 2009 for an important bottom is in 2009 and all of this is depicted in my chart in the previous post.
Now it may well be that some larger cycle is influencing the current market or that fundamental events are driving the gold cycles at this time. So my caution towards precious metals may be misplaced, but this is the source of it.
cheers,
john

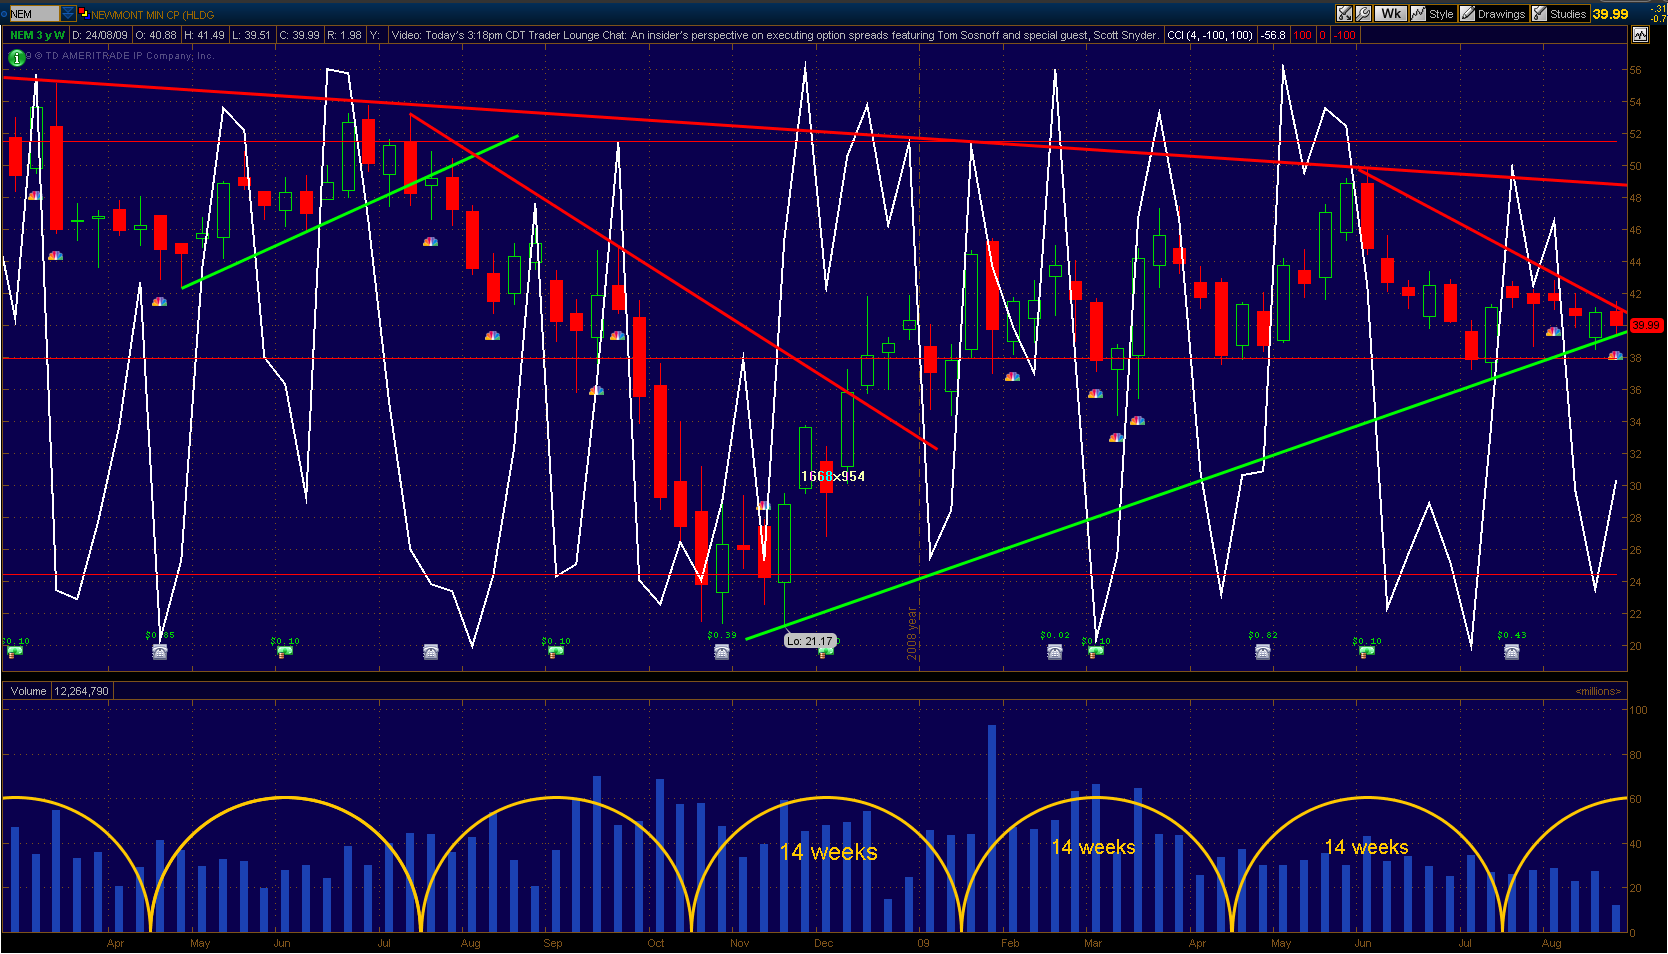
From the summer 2008 high for gold of $990, gold dipped to $680 inside 4 months. A 56 week cycle (13 - 14 months) low came in Oct./Nov. with a double bottom and a terrific rally into this summer. Where to from here? While I have zero confidence for any price targets until some FLD breaks occur, I'd sit back and wait for the next 56 week cycle low. So as I posted on the HUI Cycles thread this past week, I've hedged our gold coins (via a GLD short) and we'll see what comes from here.
Here's a view of the 13/14 month cycle on a bar chart. This corresponds to the 56 week cycle.
The other important cycle is the 27 month (half-cycle of the 4.5 year cycle). It last bottomed in August 2007 and is due to bottom in the 2nd half of 2009 or early 2010.
Finally from a long term perspective, one must bear in mind that large cycles are at play. This can distort and sometimes lengthen shorter cycles that I follow. If the 56 week cycle has already topped as I expect, gold will decline into yearend and this cycle could lengthen beyond 60 weeks before a low is seen.
The 4.5 and 9 year cycles are due to bottom in the 2nd half of 2009. Since this is the mid-point of the 18 year cycle, gold should be bullish once a low is made and rally beyond the mid-point of the next 4.5 year cycle (ie. right translated high) at a minimum.
cheers,
john
Edited by SilentOne, 09 August 2009 - 08:34 PM.