Things I never expected I'd have to deal with as a market analyst:
* Negative interest rates on government bonds
* The nightly Chinese currency fix
1:40 PM - 6 Aug 2019

Member
Posted 07 August 2019 - 07:03 AM
Things I never expected I'd have to deal with as a market analyst:
* Negative interest rates on government bonds
* The nightly Chinese currency fix
Member
Posted 07 August 2019 - 07:06 AM
Some on the FOMC think that one quarter point cut is all they are going to do. They are wrong. Eurodollar (interest rate) futures' COT data say rates are going a lot lower over next 10 months.

Member
Posted 07 August 2019 - 07:07 AM
Only Black Monday And 9/11 Were Worse Than This https://www.sentimentrader.com//blog/only-black-monday-and-911-were-worse-than-this/ … via @sentimentrader
Member
Posted 07 August 2019 - 07:09 AM
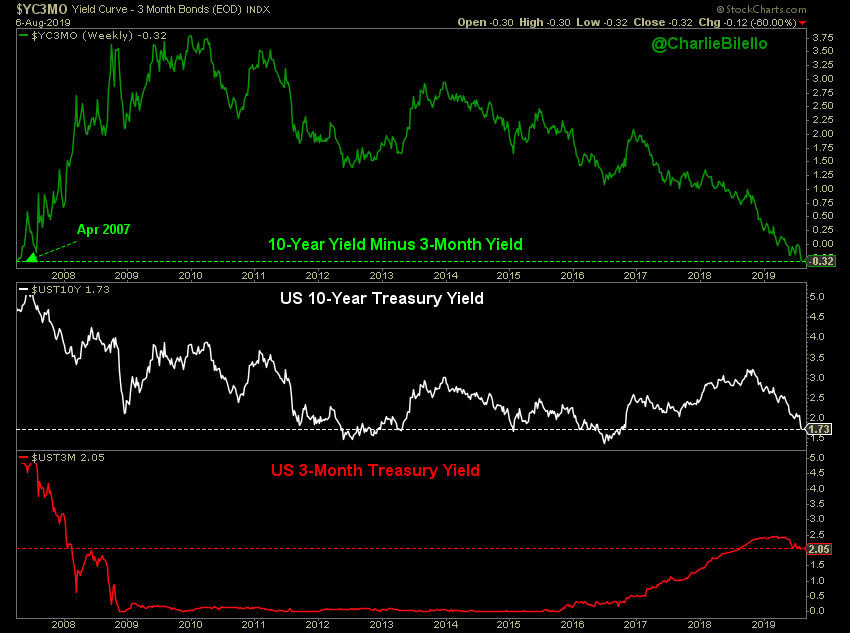
US 10-Year minus 3-Month Treasury Yield... Aug '09: 3.62% Aug '10: 2.71% Aug '11: 2.57% Aug '12: 1.49% Aug '13: 2.63% Aug '14: 2.46% Aug '15: 2.19% Aug '16: 1.31% Aug '17: 1.24% Aug '18: 0.89% Today: -0.32% (most inverted since April 2007)
Inverted Yield Curves (3-month > 10-yr) in... Mexico Hong Kong Canada US UK Norway Japan Singapore New Zealand Germany
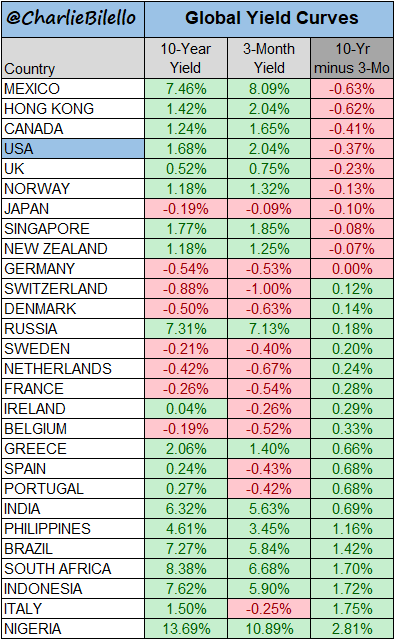
Global Manufacturing Slowdown + Inverted Yield Curves = ?

Member
Posted 07 August 2019 - 07:13 AM
Breadth Oscillator for the S&P 500 - still on a Sell signal

Member
Posted 07 August 2019 - 07:14 AM
Haven't come across the "peaks & dome" thing for quite a while
3 peaks and a Dome house - Roof structure - head and shoulder Top - 2725 SPX would be the perfect move to the neckline. 2790 would be a secondary low to watch, where the 200 DMA is.

Member
Posted 07 August 2019 - 07:16 AM
Joe Weisenthal Retweeted econhedge
Silver surging, gold up, yen surging, SNB intervening in the currency markets, stocks sliding, a U.S. election raring into high gear. It's... 2011 allover again?
Joe Weisenthal added,
Member
Posted 07 August 2019 - 07:18 AM
Germany’s yield curve flashes a stark warning on the global economy https://www.bloomberg.com/news/articles/2019-08-07/germany-s-yield-curve-flashes-stark-warning-on-global-economy … via @johnainger #tictocnews

Member
Posted 07 August 2019 - 07:29 AM
From ST:

Cluster muck
Signs of a “split” market started to trigger in mid-July and continued to accrue into the first days of August. This has been one of the tighter clusters of warning signs we’ve seen over the past 50 years.
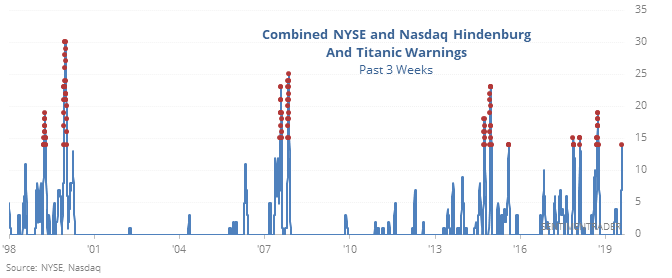
By the time some of these trigger, stocks have already declined somewhat. By the warnings’ definitions, though, the decline can’t be too much, or occur too many days from a peak. So, they often cluster early in a decline’s first stage. The only dates that escaped any meaningful selling pressure were in November 1996 and November 2017. While seasonality is an iffy crutch, those two did have the gentle tailwind of triggering during a positive time of the year.
Quick pullback
Swift, sharp pullbacks from a high tend to frighten investors since they’re not used to this kind of price action. The fears tend to be overreactions, though, with few morphing into more serious declines. Most of the time, stocks hit a new high before they suffer even a further 5% drop.
Out of the 16 times this happened, the S&P rebounded to a new high 10 times. It went the opposite direction and fell into a correction 6 times and fell another 5% beyond that (so 15% total decline) only once.
Bad reaction
This has been one of the worst-ever reactions to a FOMC rate cut. Stocks have tumbled and bonds have rallied strongly in the 3 sessions since the Fed cut rates.
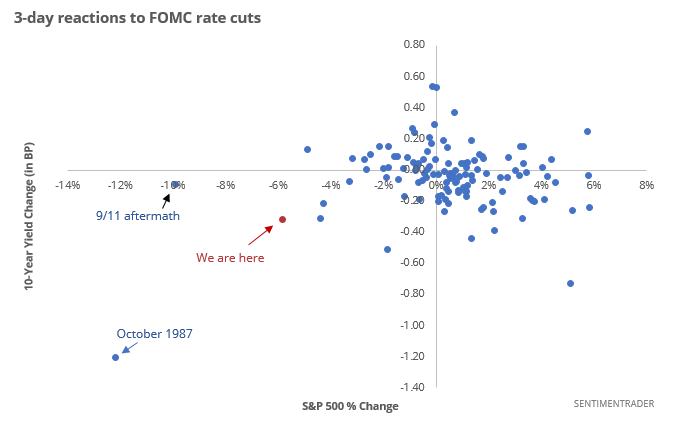
While that seems like it should be a bad omen, it has not been. It was in 2007, but that was about the only one that saw meaningful, and sustained, declines over most time frames.
Fear x 2
The original VIX, which uses S&P 100 options, has more than doubled in less than two weeks. That has happened only 7 other times in the past 30 years, and led to a rebound in the S&P over the next two weeks all 7 times by an average of 1.3%. Only 3 of them led to uninterrupted upside, though.
Stretched
The Stock/Bond Ratio has exceeded -2.9 while the S&P 500 is still above its 200-day average. Per the Backtest Engine, that has happened only once before, in early October 2014.
https://www.sentimen...orse-than-this/
Member
Posted 07 August 2019 - 09:09 AM
My one CRAZY TRADE OF THE YEAR:
will add half-position short TLT @ 142.98 OB
tolerable loss but ... still crazy


