Anybody have an alternate source for this? It's no longer an imperative tool for me, but I still like having it, but it looks like StockCharts may lose it.

Mark S. Young
Posted 09 October 2019 - 01:34 PM
Anybody have an alternate source for this? It's no longer an imperative tool for me, but I still like having it, but it looks like StockCharts may lose it.
Mark S Young
Wall Street Sentiment
Get a free trial here:
http://wallstreetsen...t.com/trial.htm
You can now follow me on twitter
Member

Posted 09 October 2019 - 02:11 PM
Anybody have an alternate source for this? It's no longer an imperative tool for me, but I still like having it, but it looks like StockCharts may lose it.
http://markets.cboe....rrent/?mkt=cone
Mark S. Young
Posted 09 October 2019 - 02:22 PM
Anybody have an alternate source for this? It's no longer an imperative tool for me, but I still like having it, but it looks like StockCharts may lose it.
http://markets.cboe....rrent/?mkt=cone
Appreciate the thought, but I'm looking for OEX, not overall index. The OEX isn't a fade (much like the VIX).
Mark S Young
Wall Street Sentiment
Get a free trial here:
http://wallstreetsen...t.com/trial.htm
You can now follow me on twitter
Mark S. Young
Posted 09 October 2019 - 02:23 PM
Also, I look at this every day. But it doesn't include the OEX. Still, appreciate the thought.
M
Mark S Young
Wall Street Sentiment
Get a free trial here:
http://wallstreetsen...t.com/trial.htm
You can now follow me on twitter
Member

Posted 09 October 2019 - 02:32 PM
You can get it from the OCC, but probably have to calculate it. Should be available after midnight after the trading day.
https://www.theocc.c...ps/volume-query
Member

Posted 09 October 2019 - 02:42 PM
They just lost NYSE Ticks on October 2nd. Not happy if they lose this too.
Edited by Spectacular Bid, 09 October 2019 - 02:43 PM.
Mark S. Young
Posted 09 October 2019 - 05:05 PM
Isn't it amazing in this day and age, with super cheap storage and computing power, that a tool we've used profitably for decades is suddenly hidden by the exchange?
Mark S Young
Wall Street Sentiment
Get a free trial here:
http://wallstreetsen...t.com/trial.htm
You can now follow me on twitter
Mark S. Young
Posted 09 October 2019 - 05:12 PM
Thank you, Darris. This may work, though it's a needless bit of work for me.
M
Mark S Young
Wall Street Sentiment
Get a free trial here:
http://wallstreetsen...t.com/trial.htm
You can now follow me on twitter
Member

Posted 09 October 2019 - 05:17 PM
Anybody have an alternate source for this? It's no longer an imperative tool for me, but I still like having it, but it looks like StockCharts may lose it.
I don't trade using sentiment, but I get that and many other indicators from Sentiment Trader. Still not at a rare extreme. 94 on the 7th and we got a bounce today.....
Anything in the 90s gets my attention.
https://ycharts.com/..._put_call_ratio
That is what I look for from his data.... When I see it I take notice.....
https://sentimentrader.com/blog/
SentimenTrader Blog
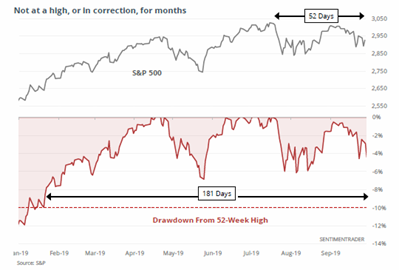 The small-cap IWM fund has seen consistent outflows over the past 3 weeks, and options traders are paying up for put protection; The S&P 500 hasn't hit a new high in more than 50 days, and it's been more than 180 days since it was in a correction; The CNN Fear & Greed model has dipped into fear; Natural gas
keeps losing
Edited by robo, 09 October 2019 - 05:27 PM.
" “There is only one side to the stock market; and it is not the bull side or the bear side, but the right side” Jesse L. Livermore


