
Partial Quote from the Previous Week:
That aside, with last week's sell off generally moving too far and too fast, along with a small point change on the NYSE Composite breadth MCO and a NYSE Open 10 TRIN reading of 1.14 on Friday, let's look for a bullish start for the week ahead that has a pretty good chance of extending into end of the week. What we see after that will likely determine on what we should expect for the rest of the month.
It turned out to be an entertaining week of trading with market participants first running prices up, then down, then up again and then settling with an average gain of +.78%. Leadership this week came with the small caps as the S&P 600 (+1.84%) had its first gain in the last three weeks, while the NASDAQ Composite Index was the weakest link as it lost -2.06%.
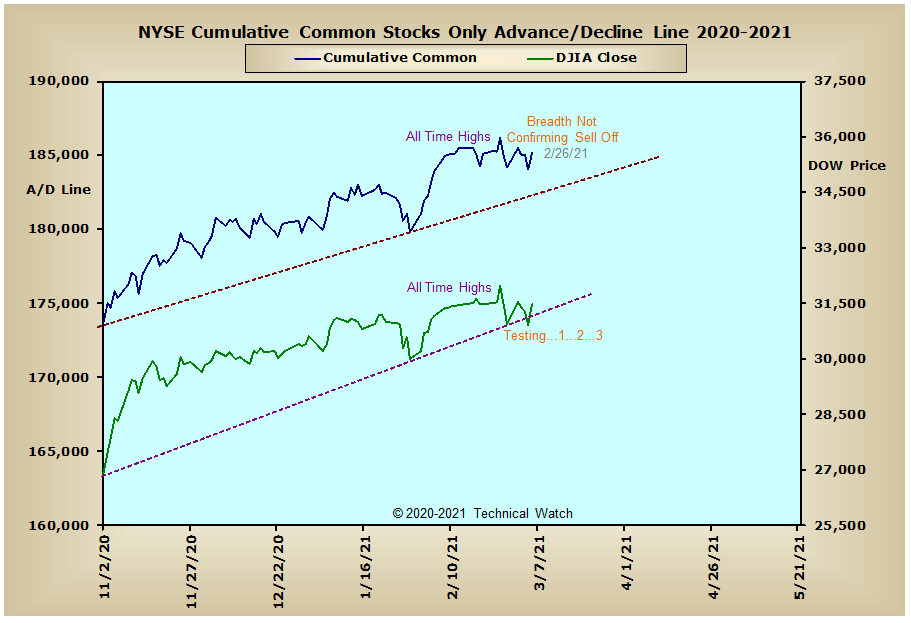
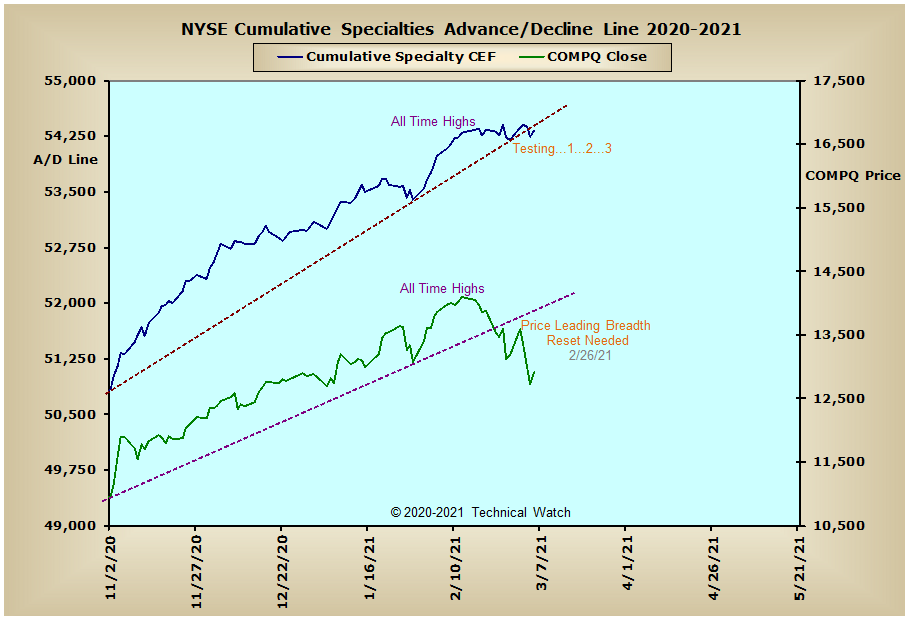
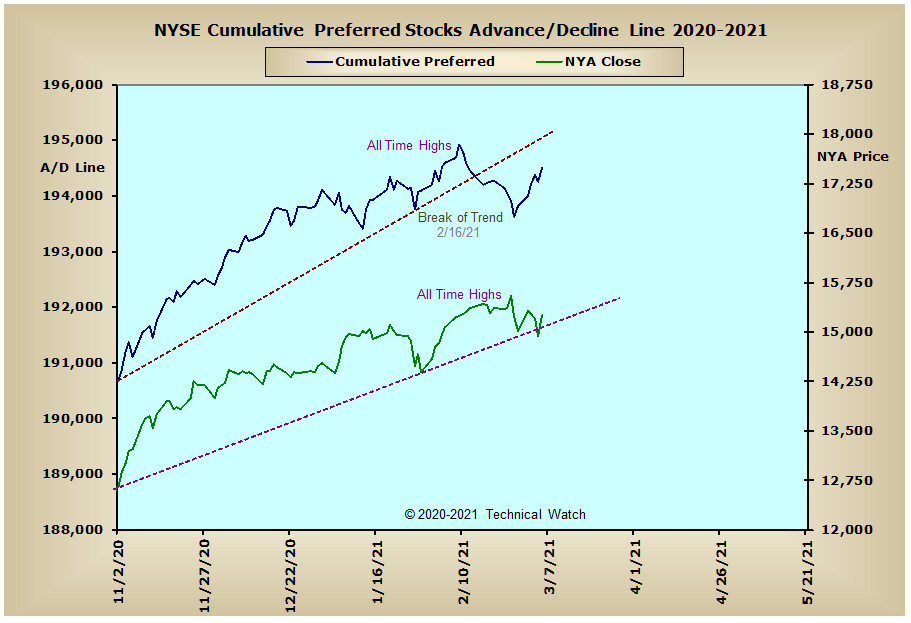
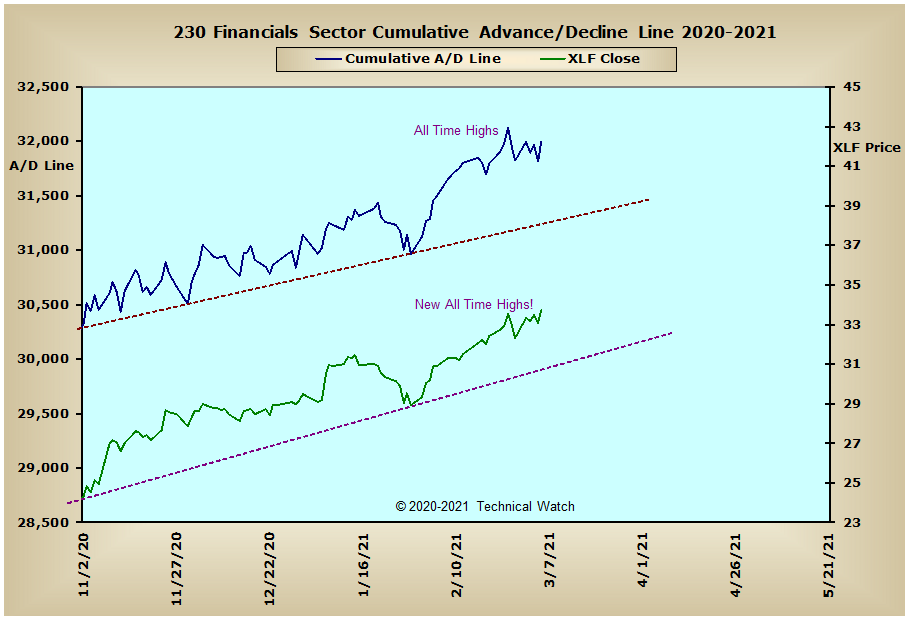
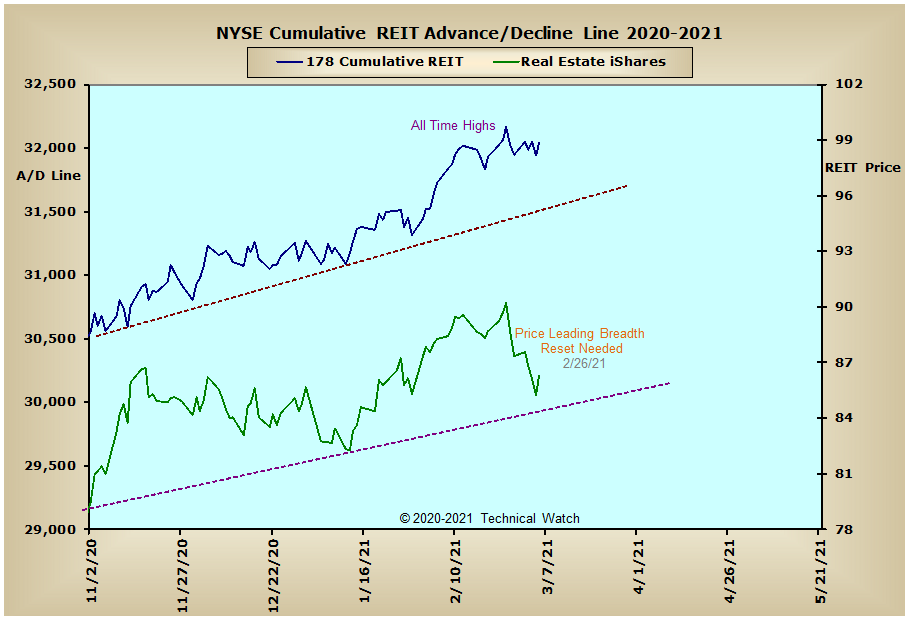
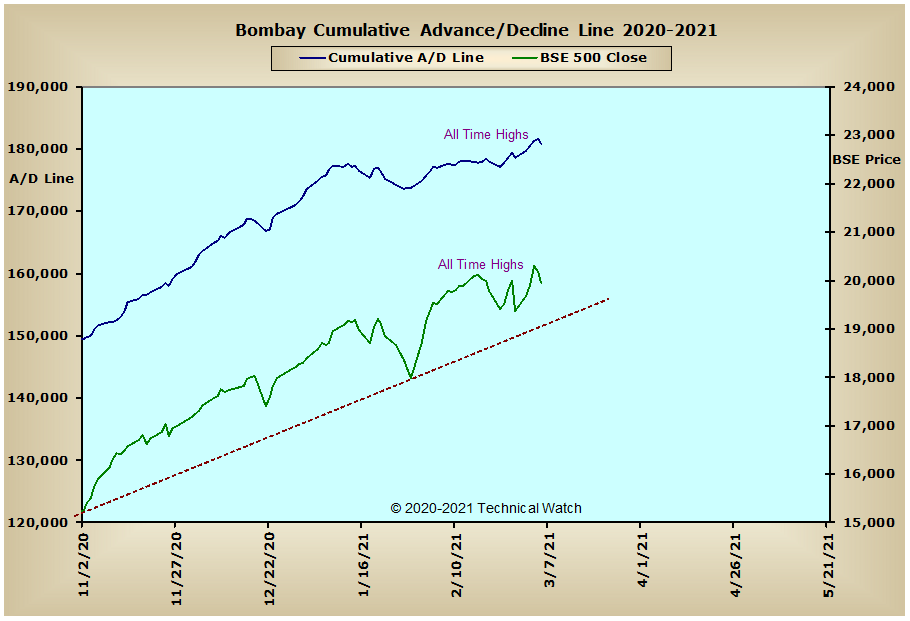
Looking over our standard array of cumulative charts for this week shows a bit of a mixed picture with the interest rate sensitive issues weighing down most of the NYSE related equity charts which seem to be moving net sideways at this time. Sector wise, both the NYSE REIT and Financials Sector advance/decline lines remain near their all time highs, while the Energy Sector advance/decline line continues to push further into new recovery high territory. On the other hand, both the Precious Metals and XAU advance/decline lines continue to trend lower and this is now weighing heavily on Australia's Old Ordinaries advance/decline line after it found longer term resistance at its previous highs of January 2020. India's Bombay advance/decline line continues to make new all time highs, however, and this is good news for global emerging markets including the small caps and secondary stocks here in the United States.
So with the BETS gaining 10 points this week to a reading of +50, the marketplace remains friendly toward both traders and investors. With many of the cumulative advance/decline lines now moving net sideways, this then allows the 19 day EMA (10% Trend) to slow (or even reverse) its rate of ascent, while allowing the 39 day EMA (5% Trend) to narrow the gap between the these two EMA measurements. We can ascertain the speed factor (amplitude) of these same EMA's with the components data that makes up each McClellan Oscillator with their positions, either above or below their respected zero lines, including which direction they're moving. As of Friday, for example, the 10% Trend on the NYSE Composite breadth MCO was back above its zero line indicating that the 19 day EMA of the NYAD line had turned higher, while the 5% Trend continues to remain just above its zero line and reflecting a decelerating rate of ascent. The McClellan Summation Index then takes this information and shows us, on a cursory basis, how far away each one of these same EMA's are from each other, with the MCSUM zero line indicating a crossover between these two EMA component comparisons. So although many would currently point to both the McClellan Oscillator and McClellan Summation Index as proxies of a negative market environment is not really telling the full analytical story of which these tools provide. In any event, last week's rocking and rolling did quite a bit of technical good for the NASDAQ Composite Index as it continues to relieve its highly "overbought" condition. This included the NASDAQ Open 10 TRIN which finished the week at its highest "oversold" levels (1.02) since the October 2019 bottom (yes, even beyond that of the COVID crash lows). Along with NASDAQ breadth MCO (-94) and the NASDAQ volume MCO (-119) spiking deeply into "oversold" territory on Thursday, this now suggests that all of the willing sellers are now out (or nearly so) which only leaves the "unwilling" sellers to provide the bullish divergences necessary for a potential Elliott 5th wave run to the upside between April and June of this year. But while we wait for that potential to happen, let's go ahead and remain on the bullish path of least resistance for the week ahead, while continuing to be highly disciplined as volatility maintains its proverbial thumb on the short term scale.
Have a great trading week!
US Equity Markets: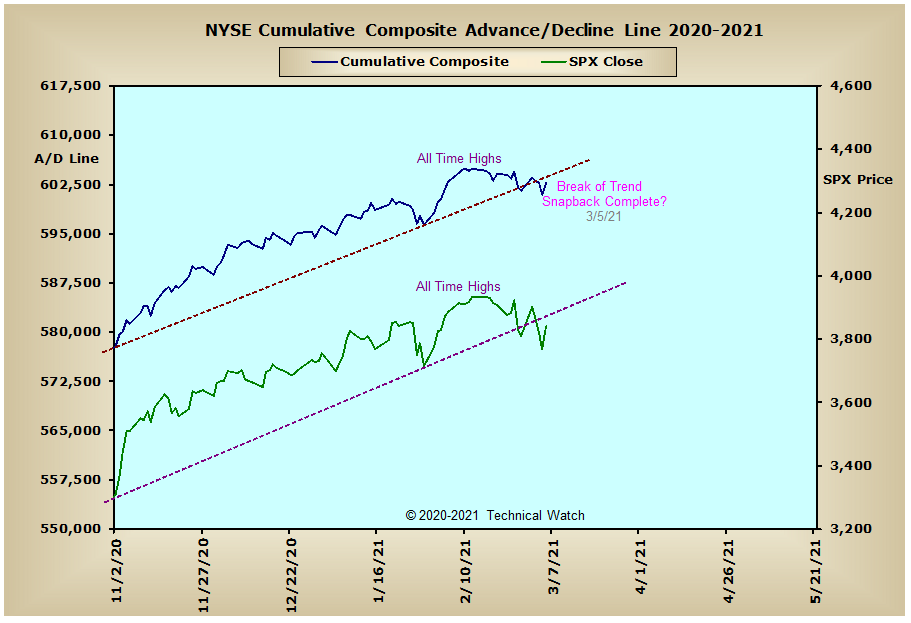

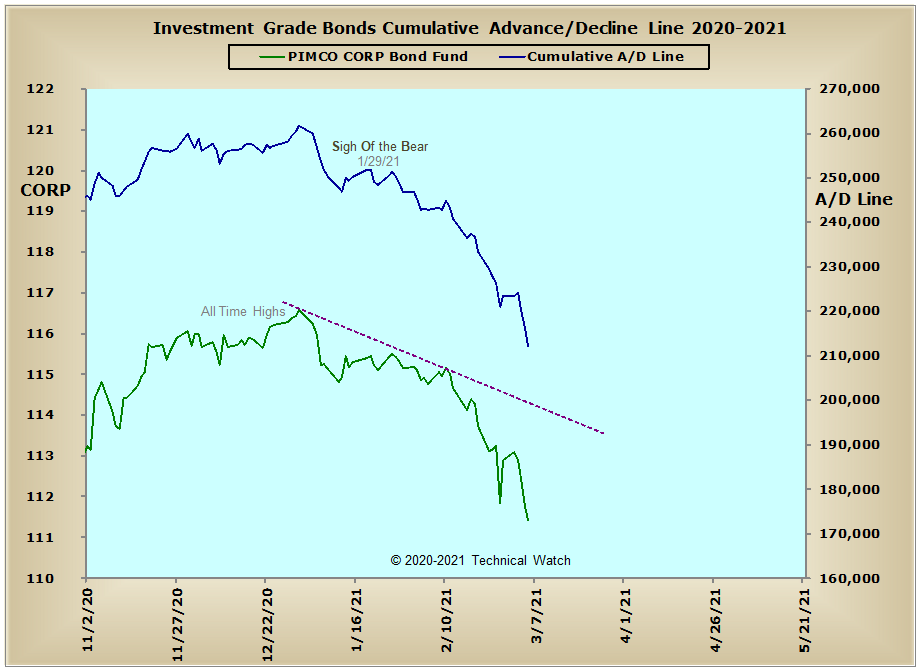
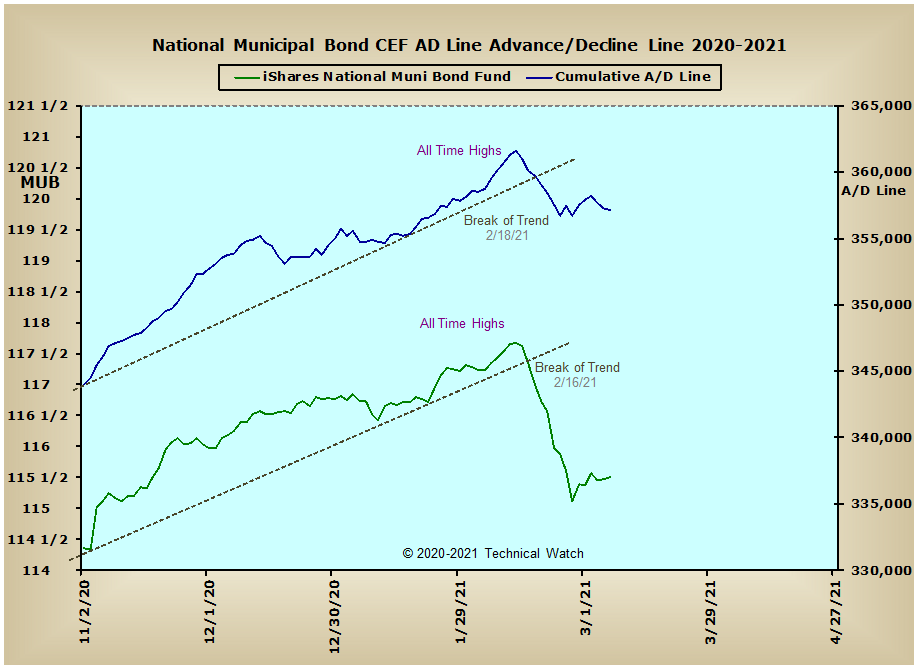
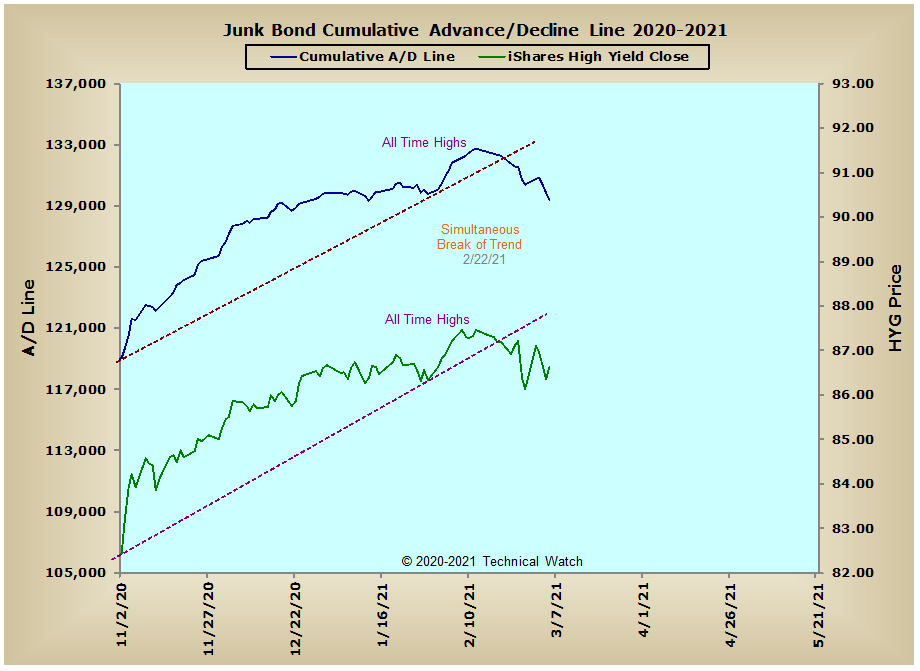
US Interest Rates: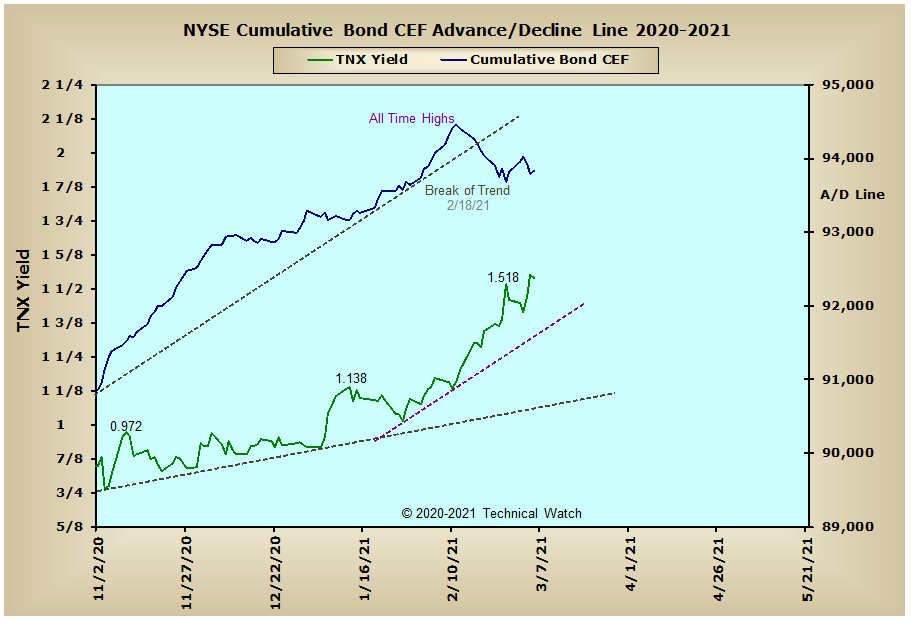
US Sectors: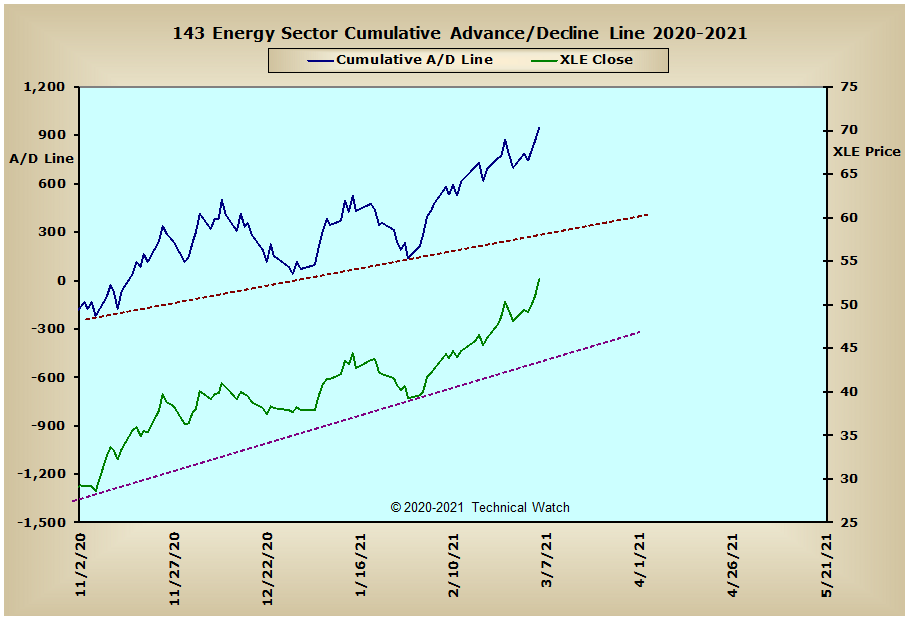
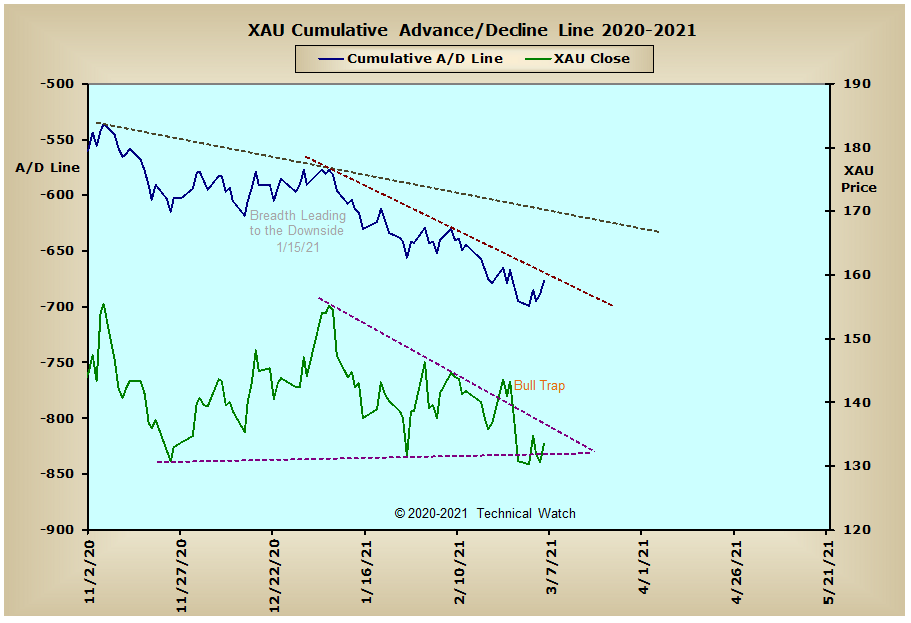
Precious Metals: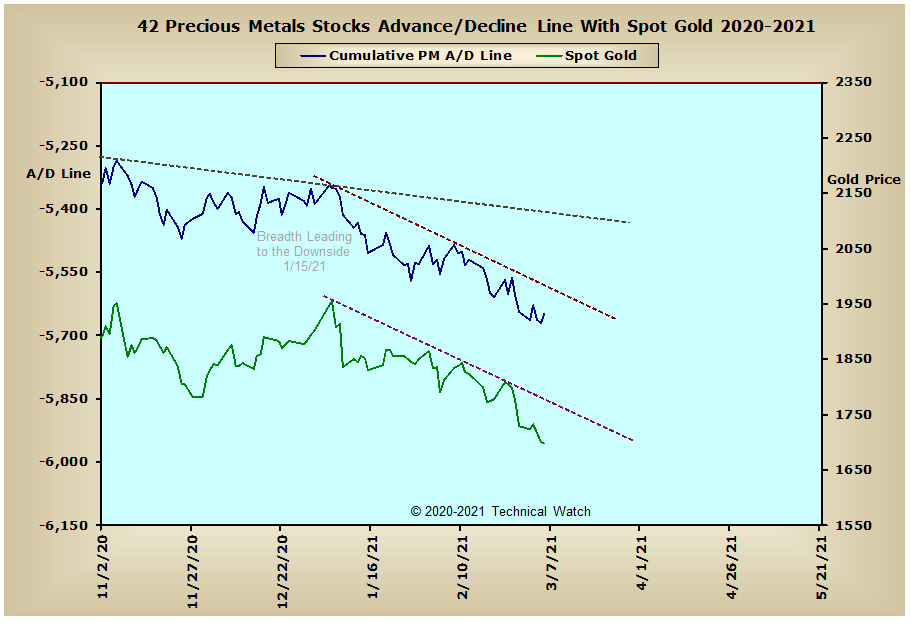
Australia: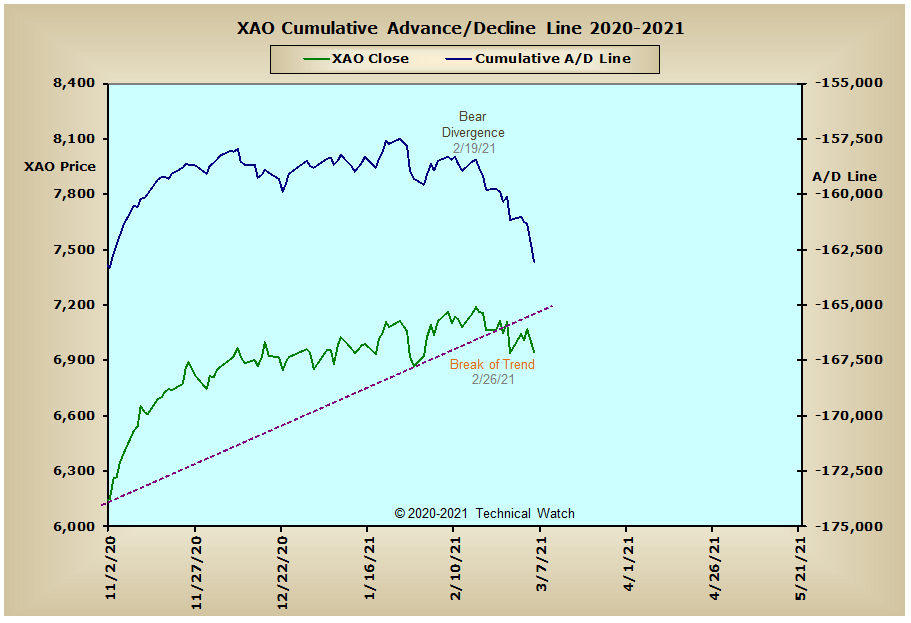
England: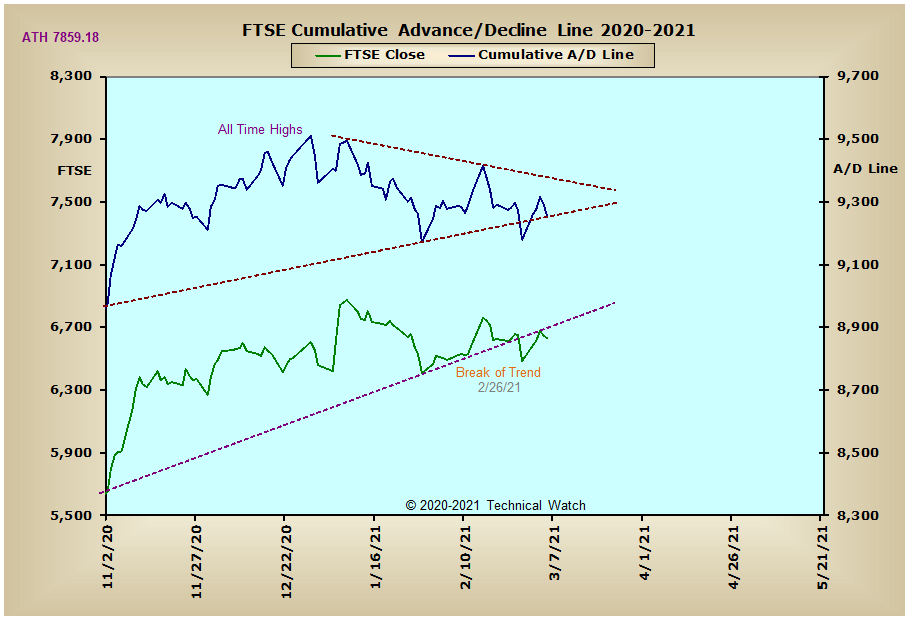
France: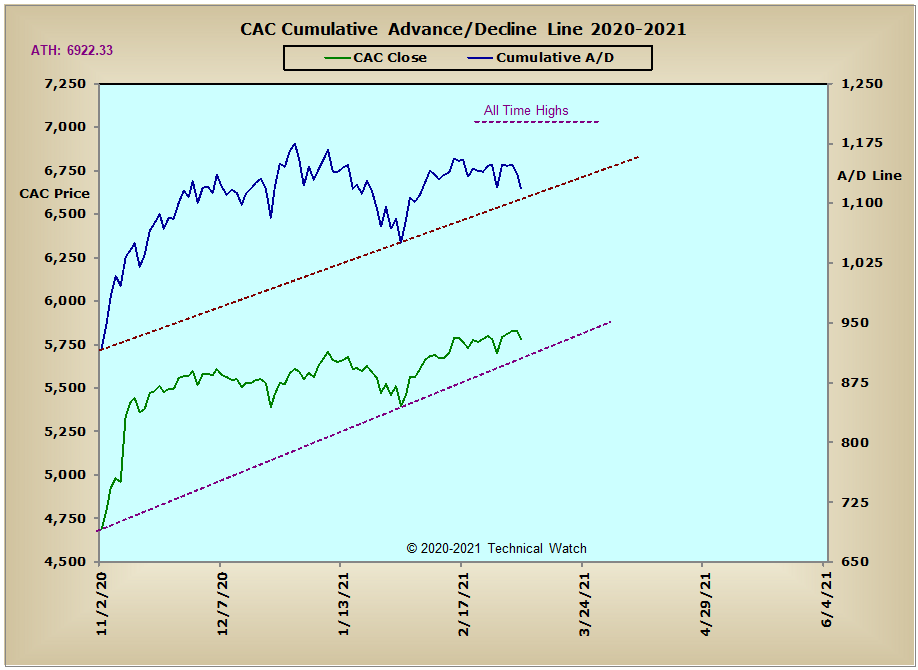
Germany: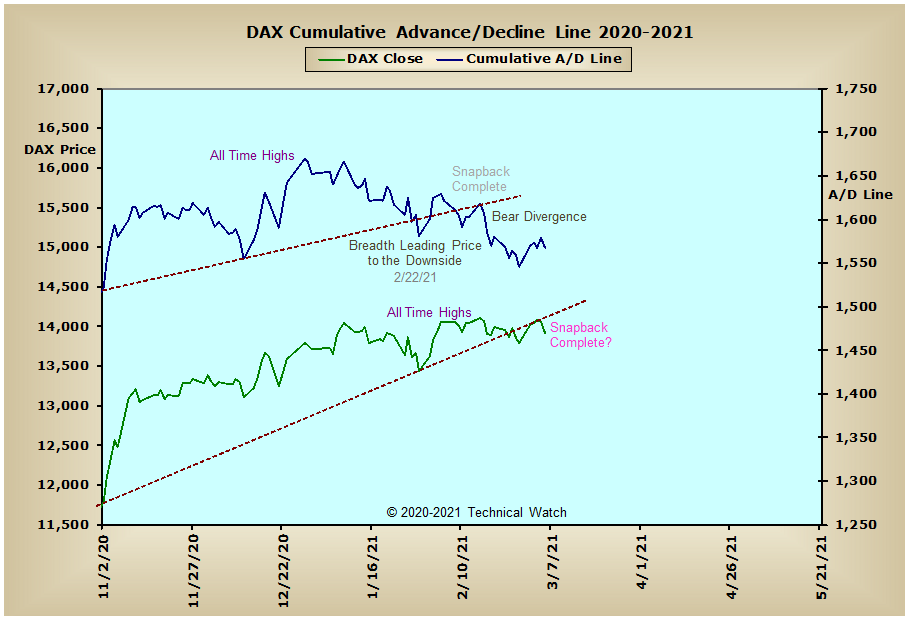
India
Edited by fib_1618, 11 March 2021 - 11:55 PM.


