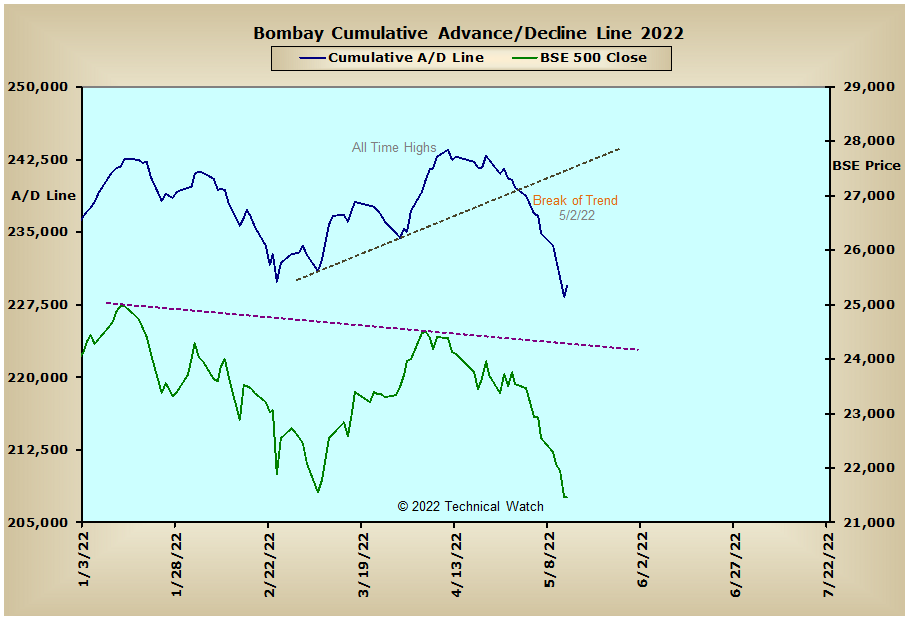
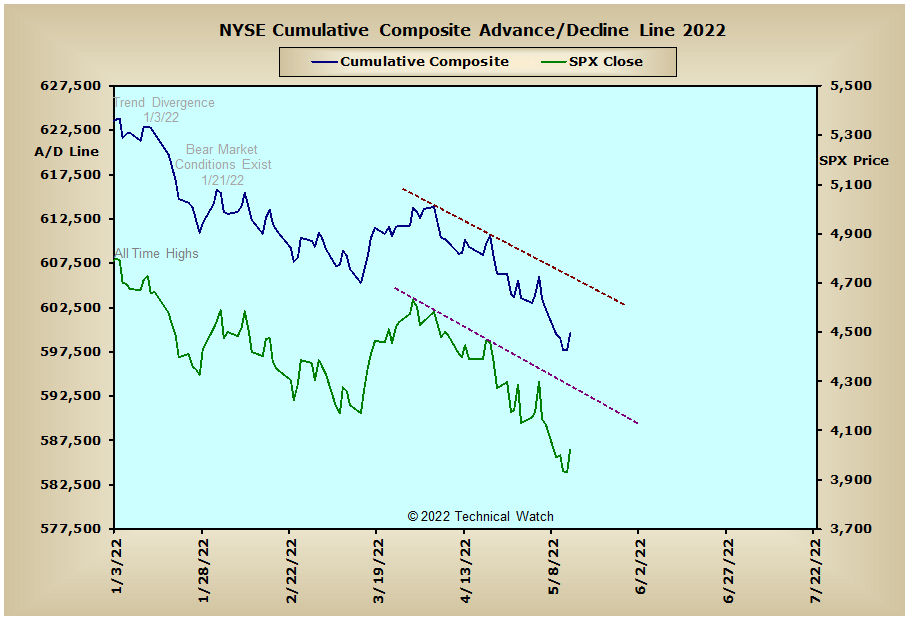
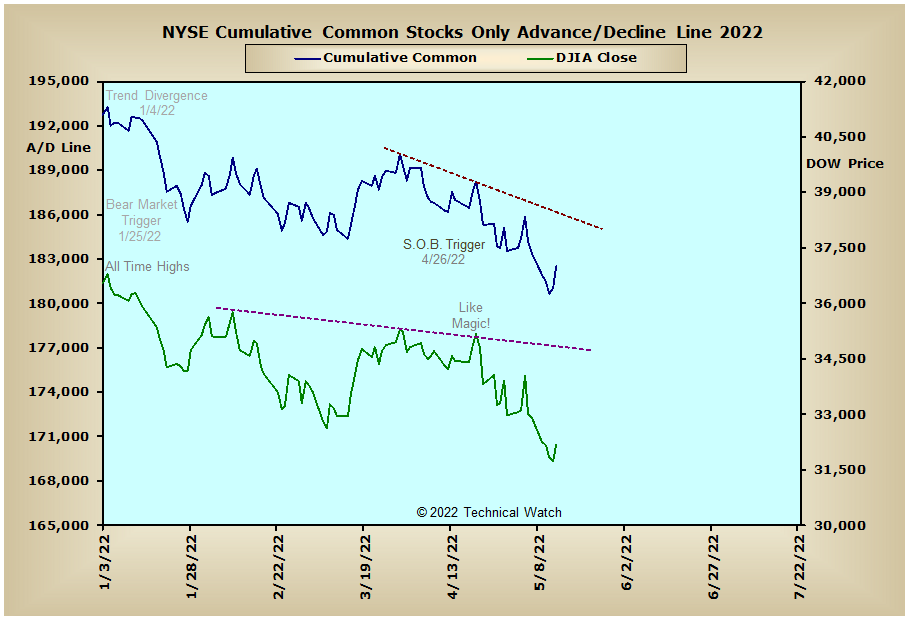
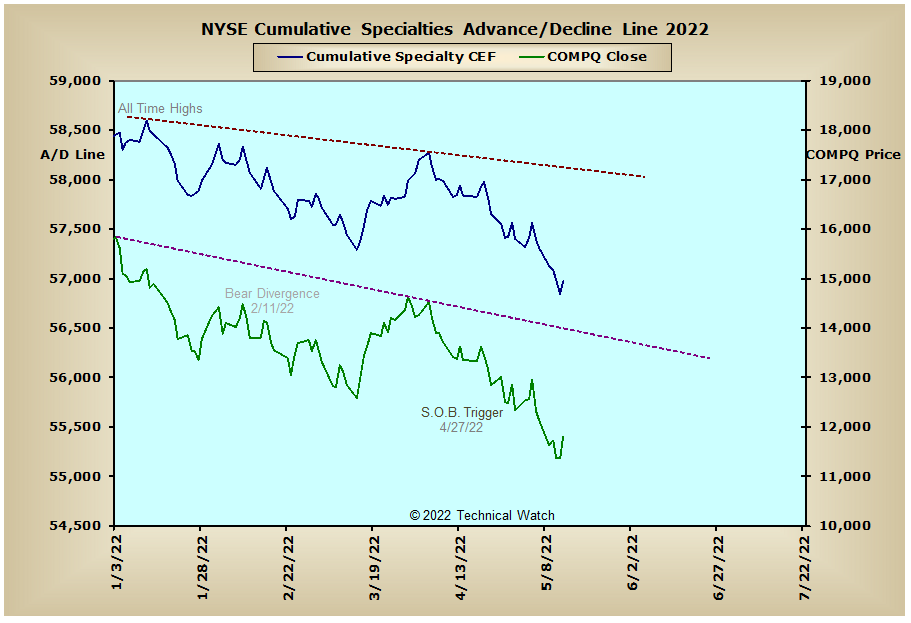
After pushing lower for much of the week, the equity markets grabbed onto an extended branch late Thursday into Friday to cut its average losses to only -2.16%. Leading the way lower was the NASDAQ Composite Index which lost another -2.80%, while the S&P 600 Small Caps held up better than the rest as it gave back -1.61%.
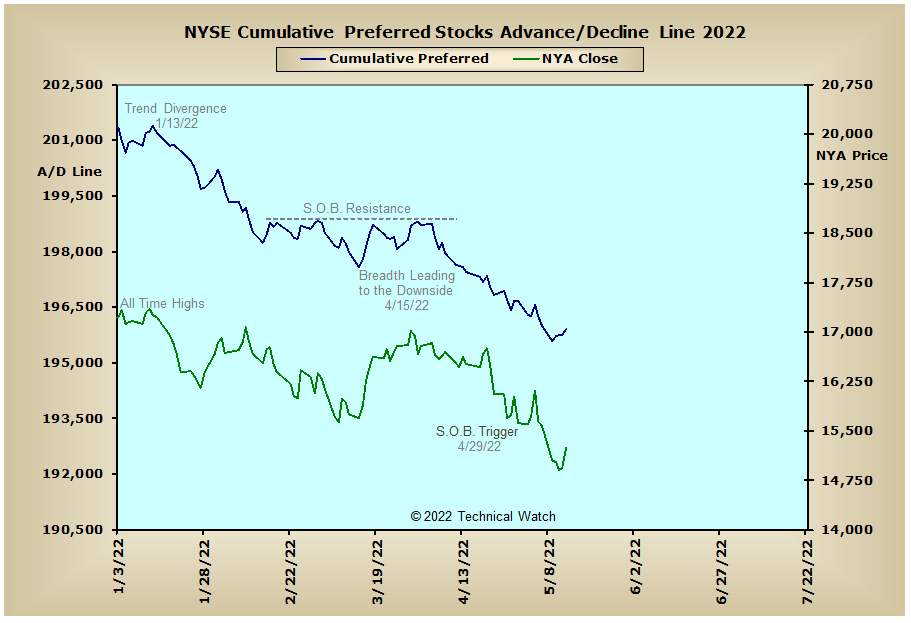
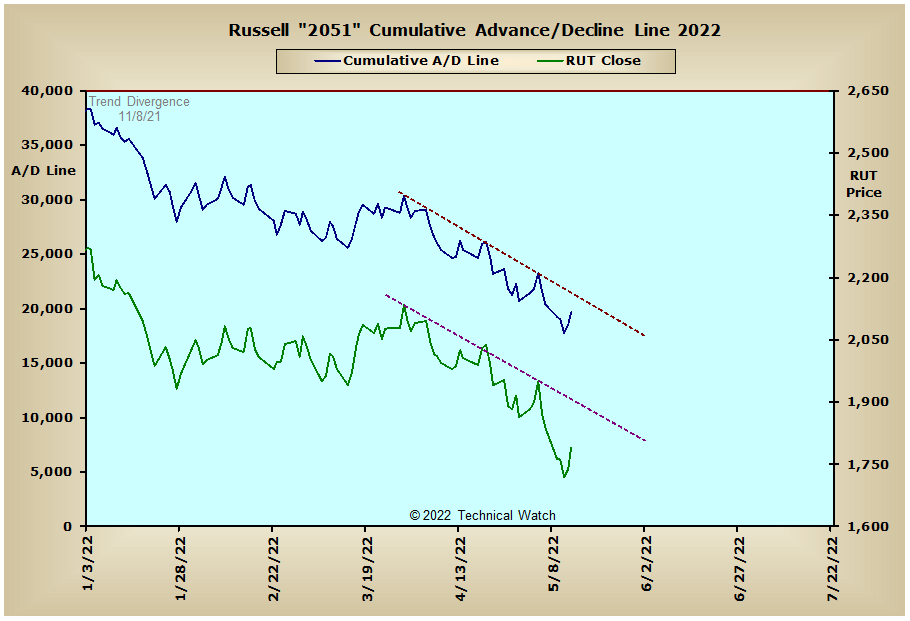
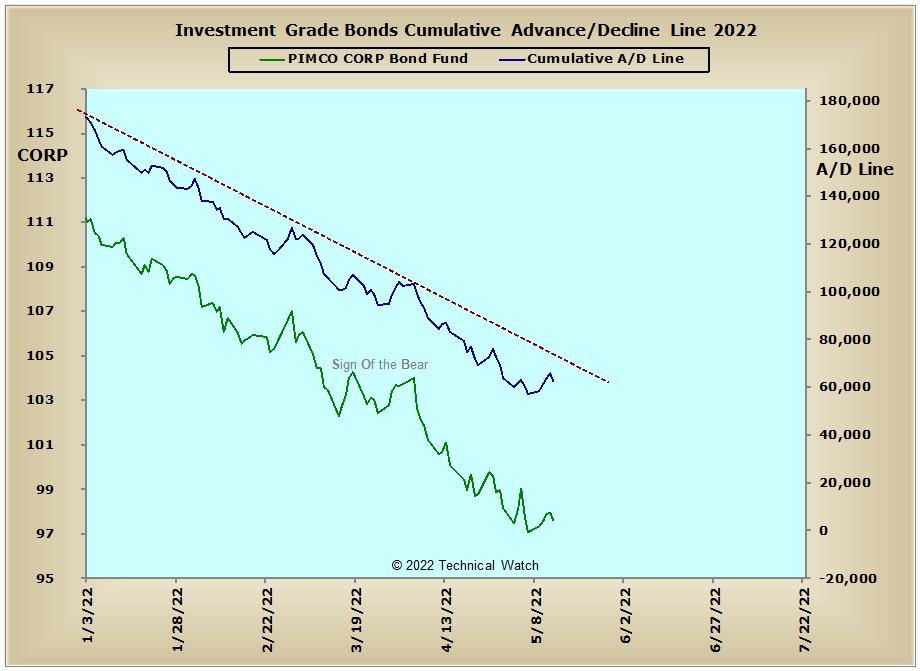
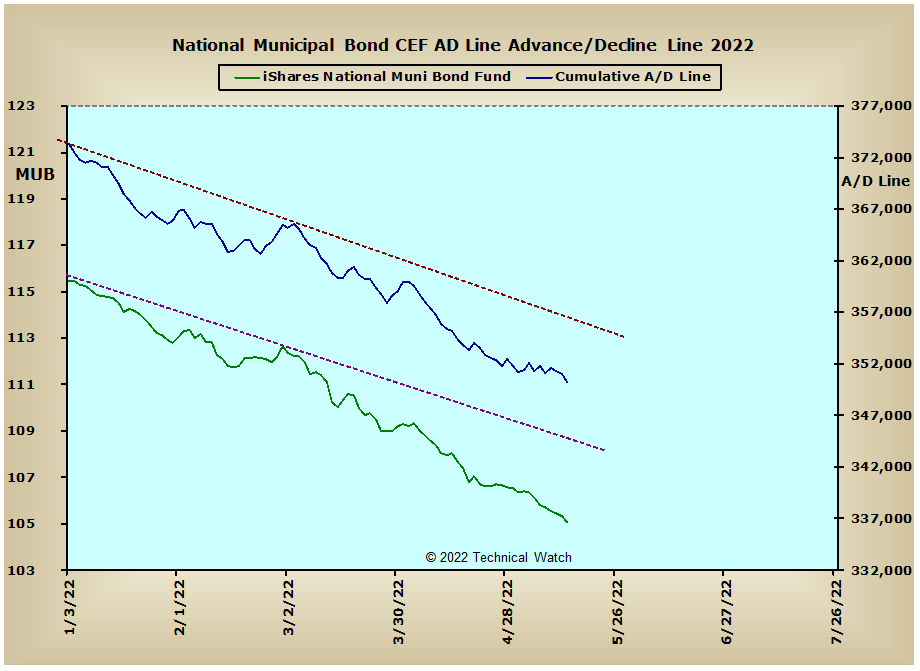
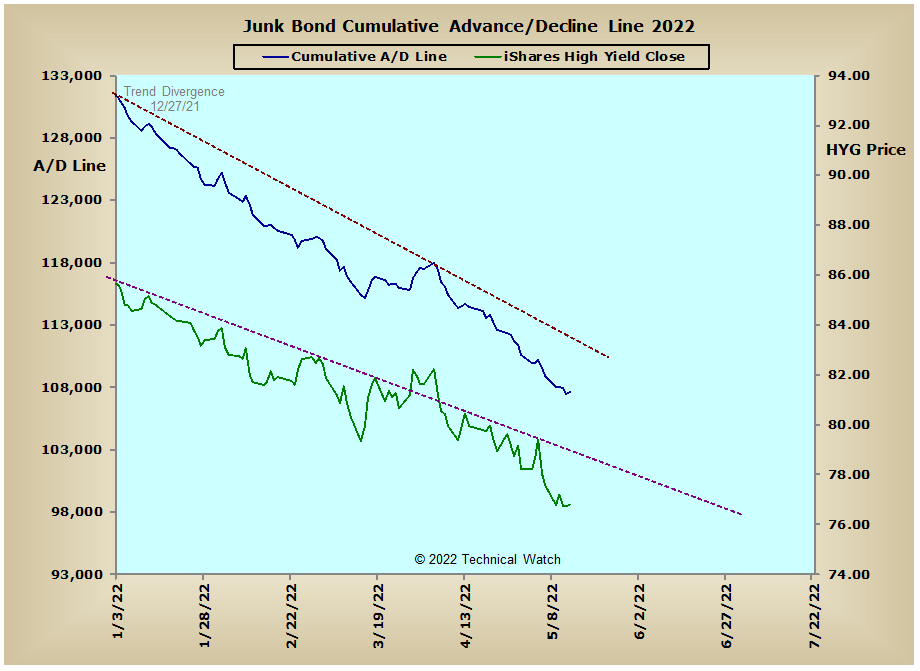
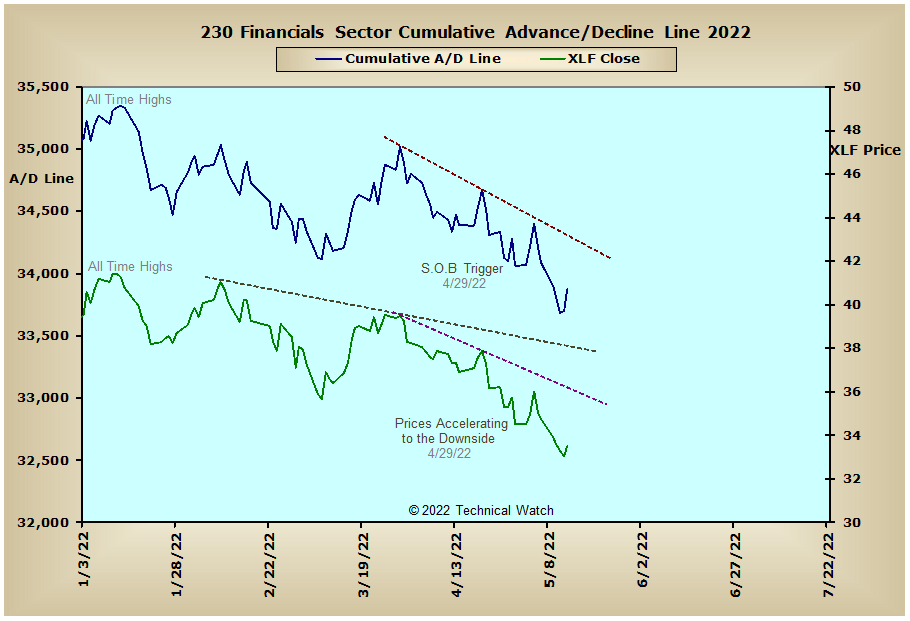
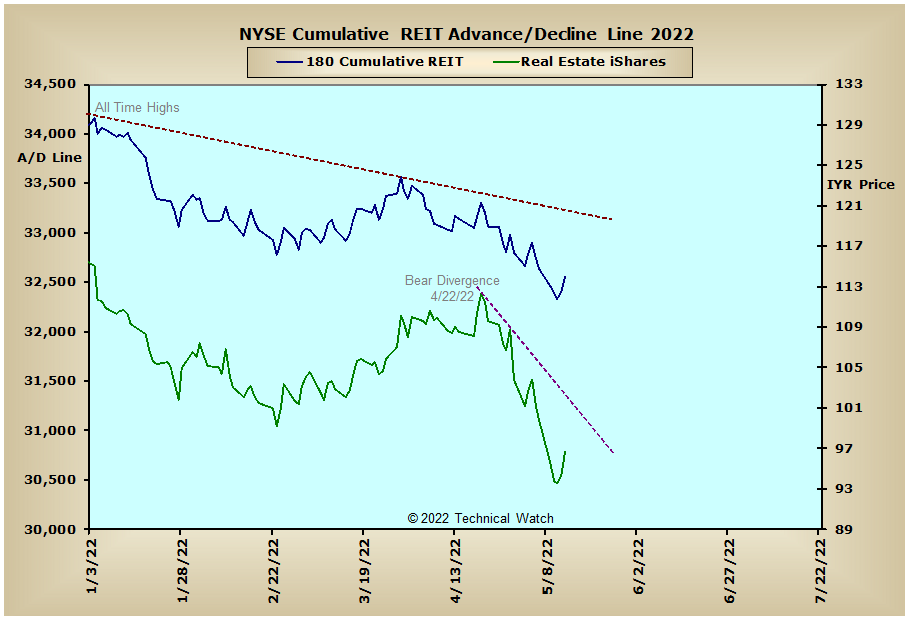
Looking at our standard array of cumulative breadth charts for this week shows very little in the way of analytical changes as the majority continue to trend to the downside. The exception, of course, remains with the Energy Sector advance/decline line as it continues to work off last week's bearish divergence between breadth and price. With this sector historically the last one to top out in a bull market sequence, any further weakness from here in the weeks ahead would send a signal that lower equity prices will likely be with us for much of the upcoming 3rd quarter (July-August-September). Meanwhile, European bourses seem to be holding up better than one would expect given the ongoing hostiles and warmongering to their east, howbeit, all do remain with a bearish bias at this time.
So with the BETS holding steady at -50, traders and investors remain with a defensive posture toward equities. Friday's rally allowed all of the breadth and volume McClellan Oscillators to snapback to or toward their respective zero lines where near term resistance is likely given that all of the MCO components remain in negative territory at this time. As mentioned in the chat, until we see all of the MCO's move to new reaction lows unanimously, aside from the occasional "hiccup" event, prices will continue to trend to the downside on an intermediate term basis. With Friday's NYSE TRIN number at .30, and the NASDAQ TRIN coming in at .36, this strongly suggests that the shorts stampeded to cover their positions going into the weekend. These same daily numbers have now pushed the NYSE Open 10 out of "oversold" territory at .97, while the NASDAQ Open 10 is now technically "overbought" with a reading on Friday of .75. As we go into this coming weeks OPEX event, put positions eased off last week as did their premiums. This might suggest some near term choppy behavior as we begin the week ahead that might even last into May expiration on the 20th. With all this as a background then, let's again continue to walk along the bearish path of least resistance, while looking for the occasional bullish surprise that might pop out from behind the trees and bushes directly ahead of us as we mosey along this same path.
Have a great trading week!
US Interest Rates: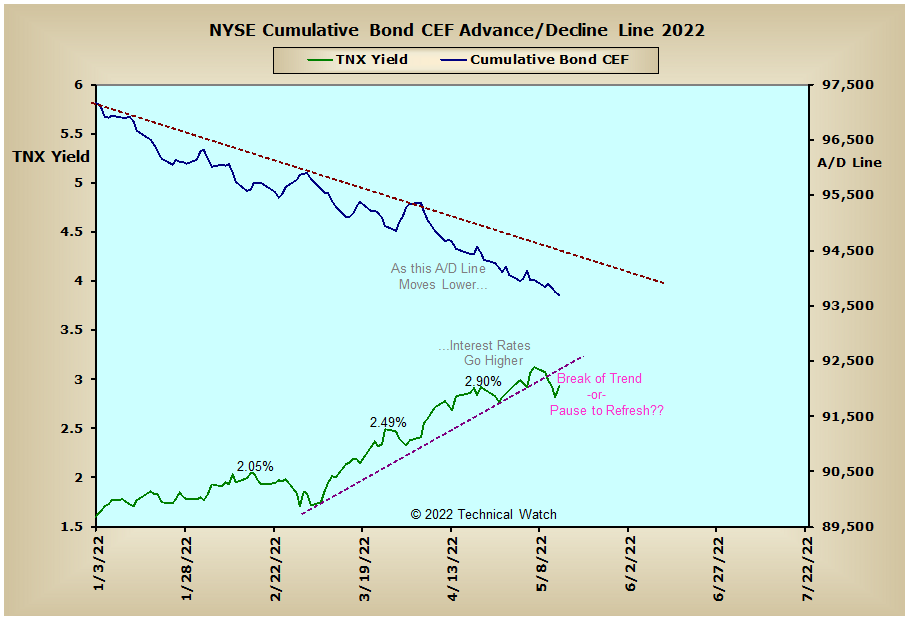
US Sectors: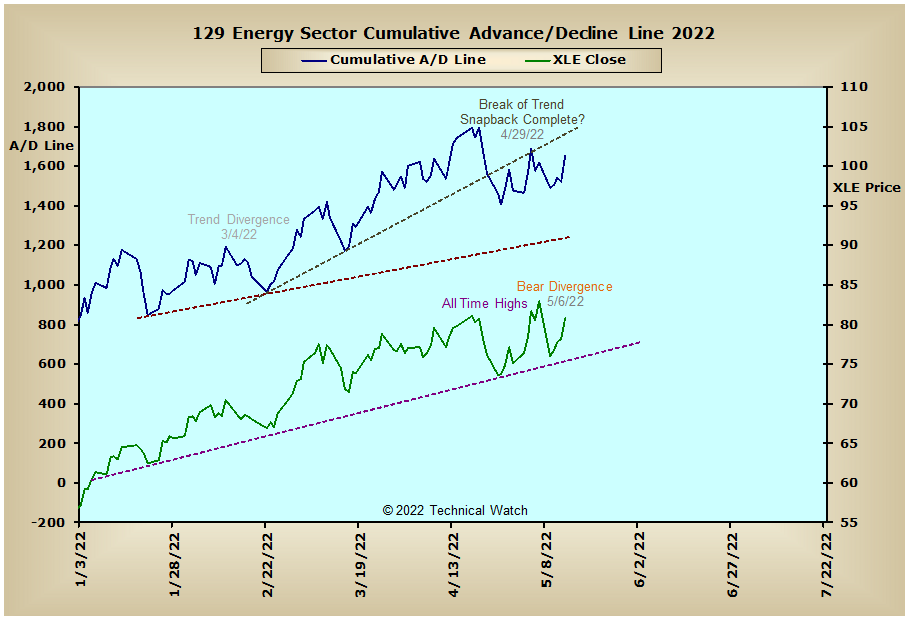
Precious Metals: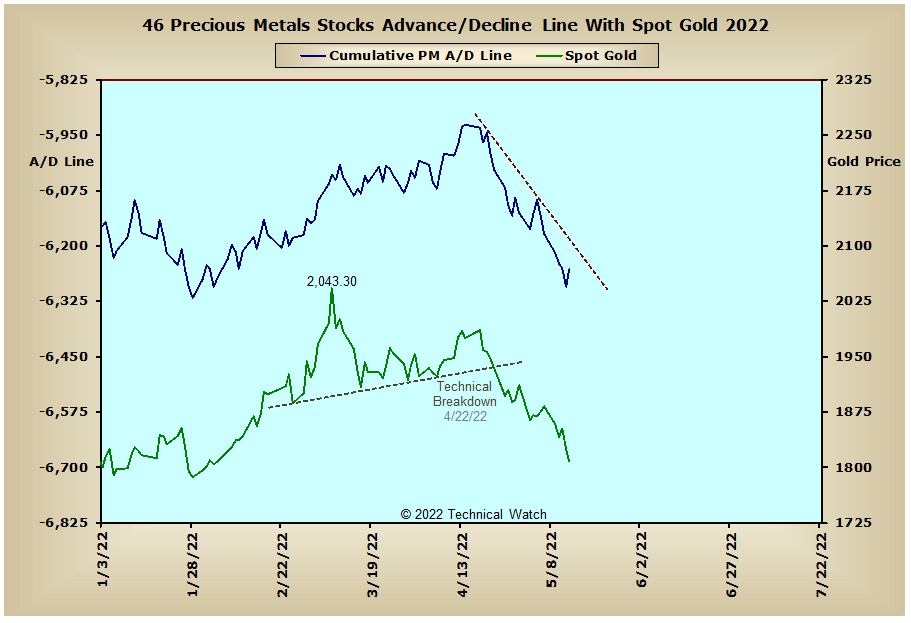

Australia: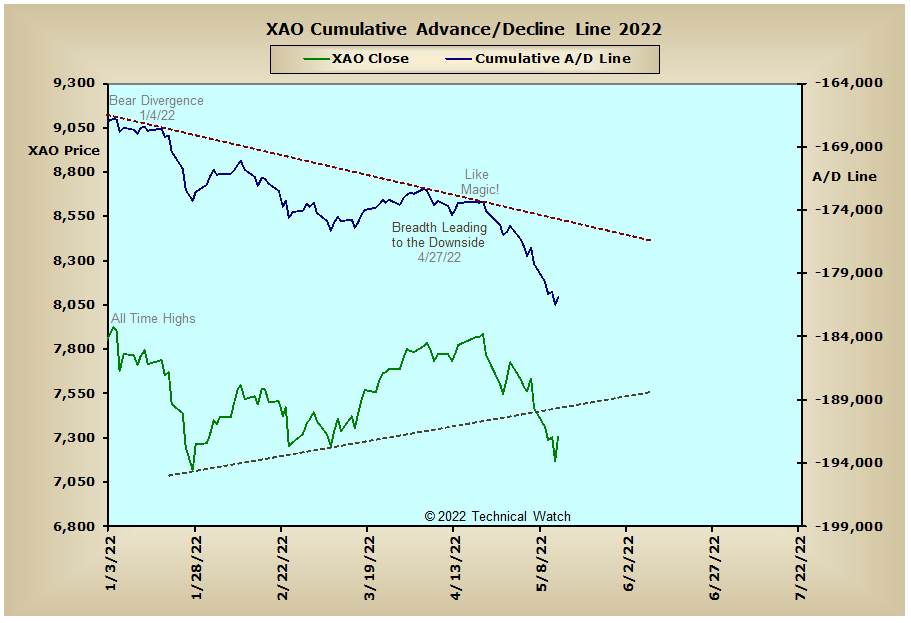
England: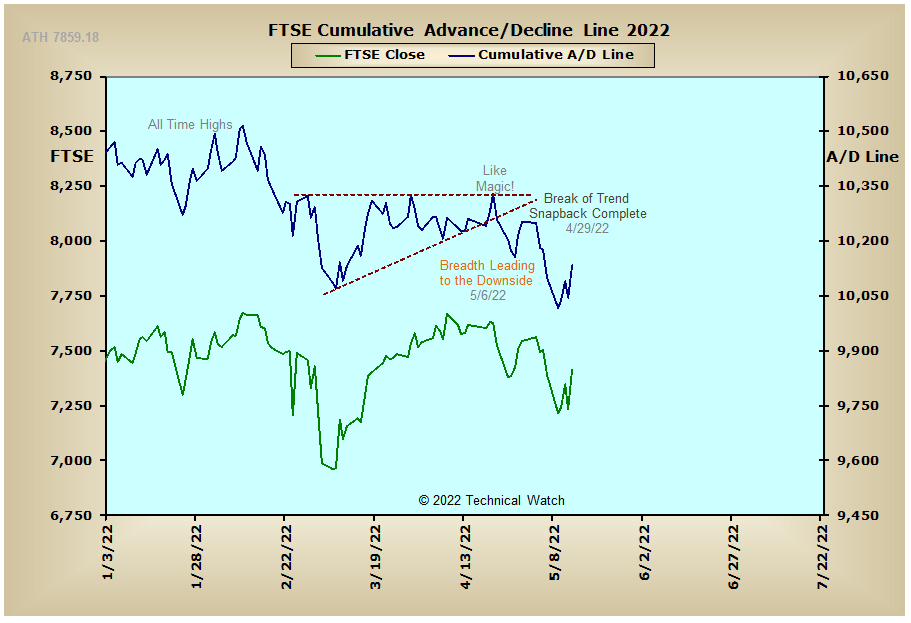
France: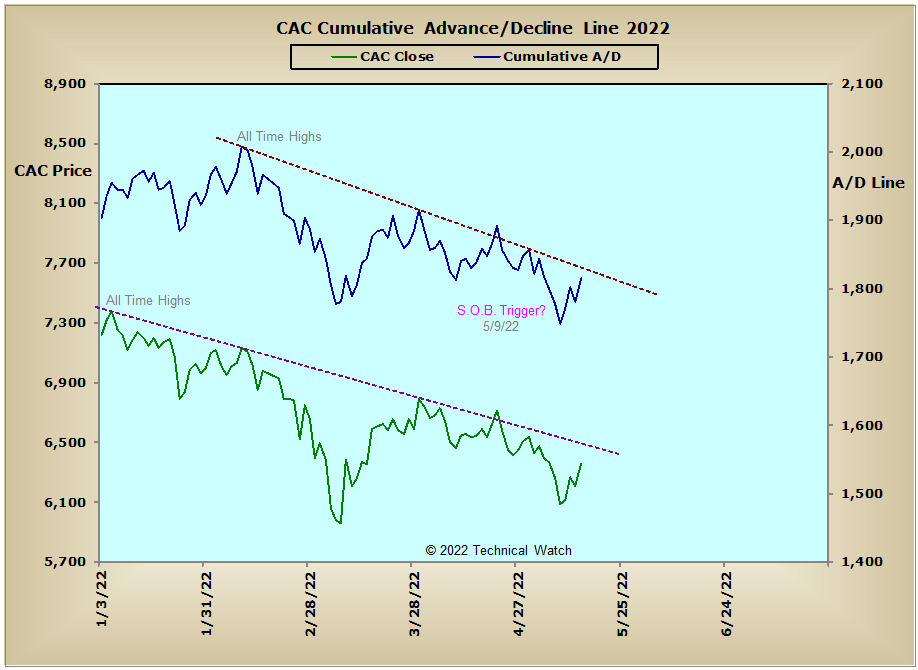
Germany: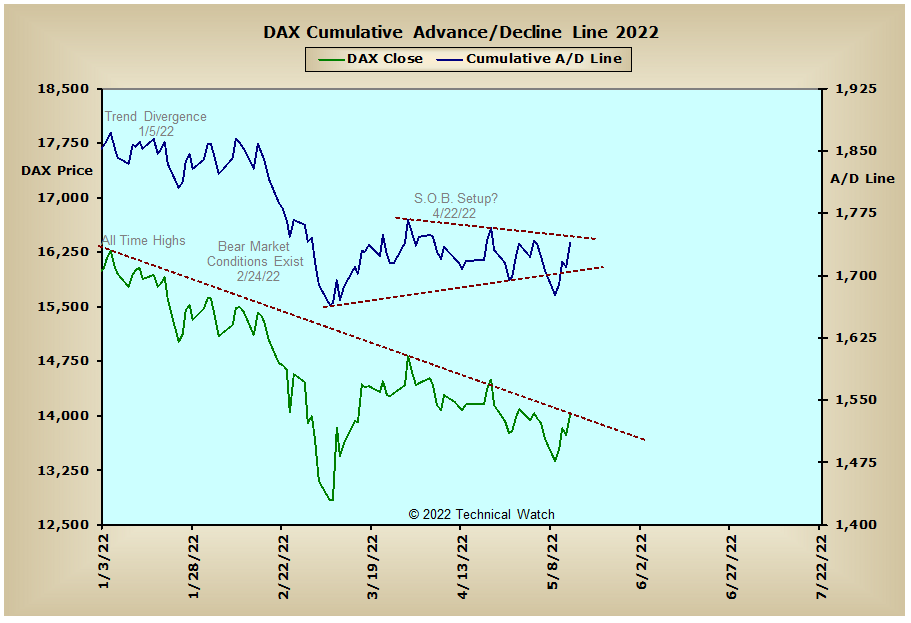
India: