It turned out to be another good week for the market bulls as the major market indexes finished higher on Friday with an average weekly gain of +4.66%. This week's advance was led by the Dow Industrials (+5.72%), the S&P 400 Mid Cap Index (+5.31%) and the S&P 600 Small Cap Index (6.15%) as all three closed above their respective 200 week EMA's for the second week in a row. Meanwhile, the NASDAQ Composite Index was the weakest link with a gain of only +2.24% as prices there continue to snapback up toward this same weekly EMA. One other item of note is that with one day to go in the month of October, the average market gain currently stands at a resounding +10.15%. If this gain holds up after Monday's trading, this number will likely be largest percentage gain for the month of October in history!
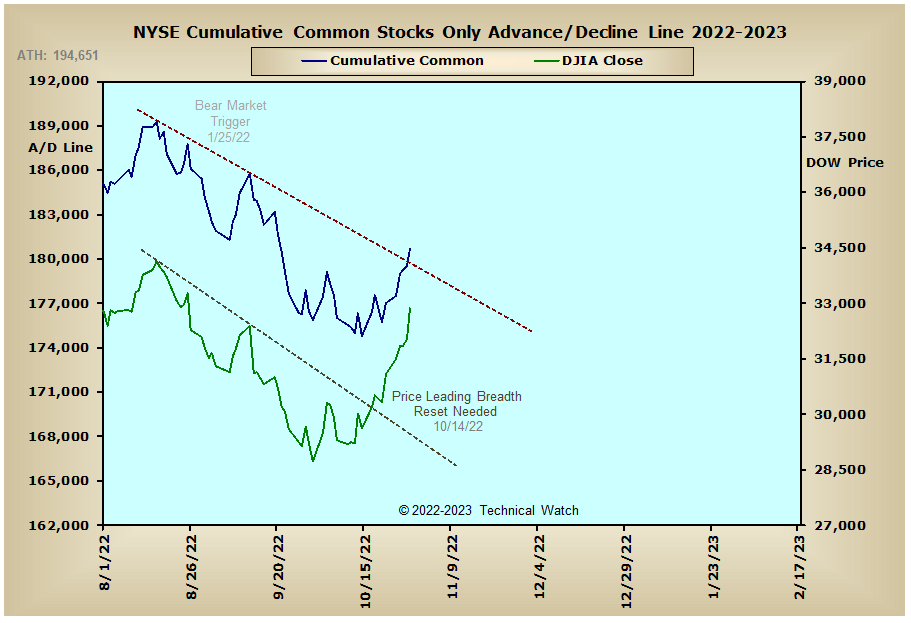
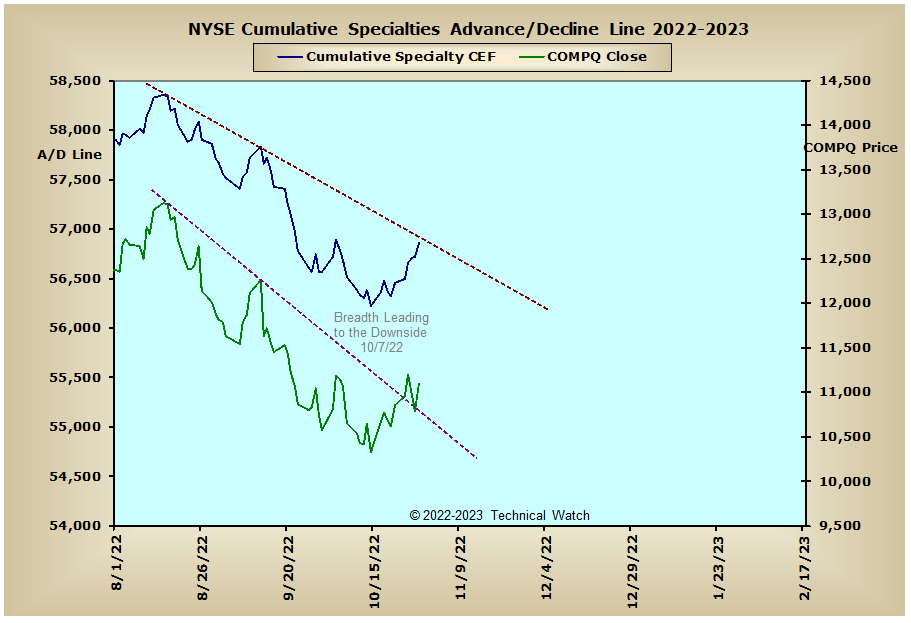
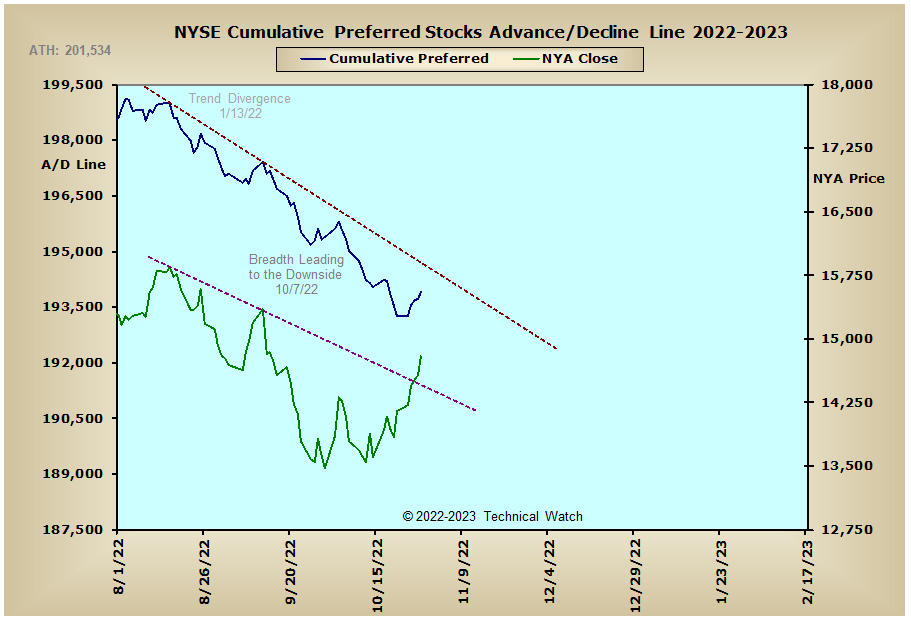
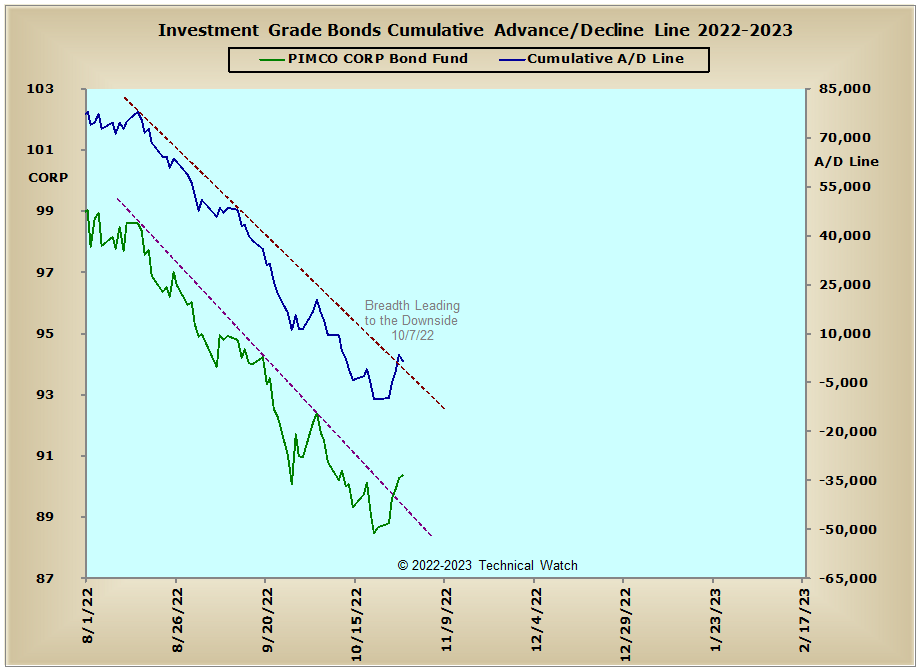
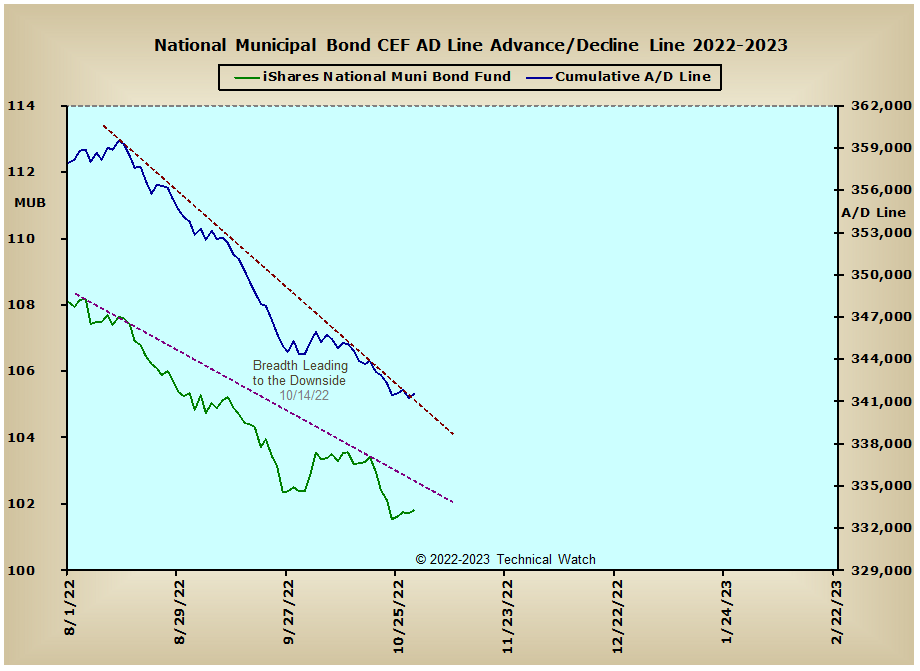
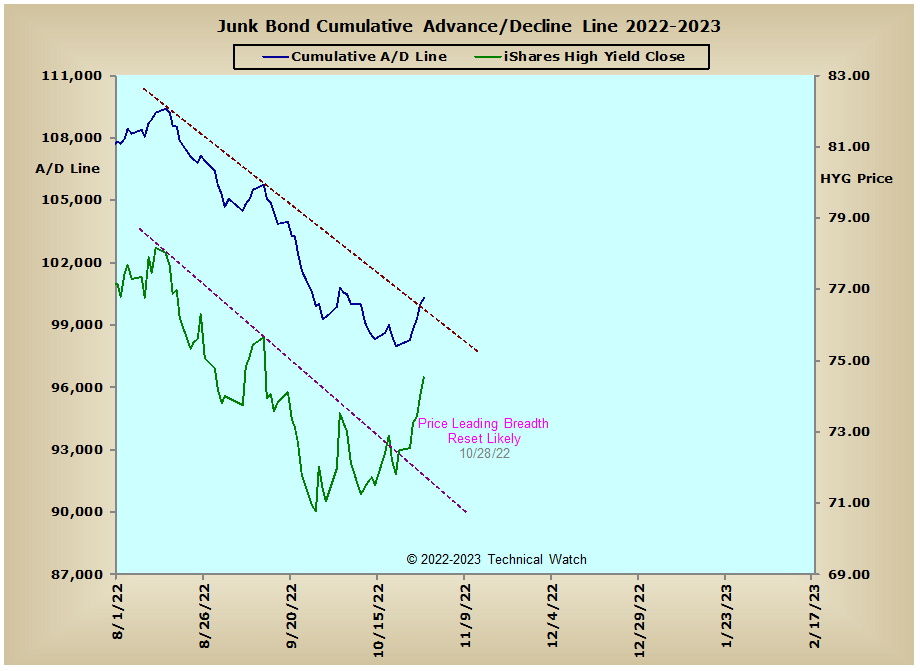
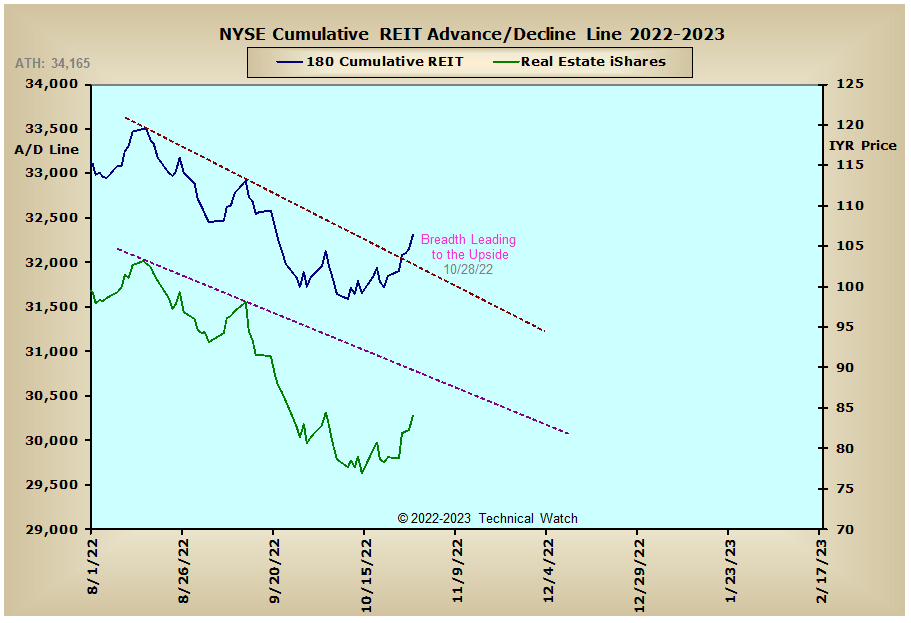
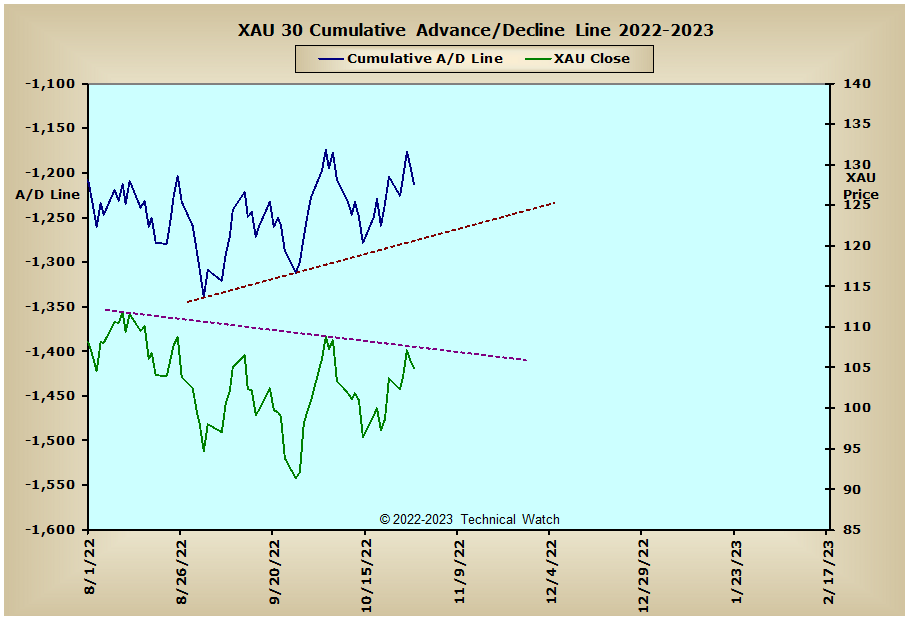
Looking over our standard array of cumulative breadth charts for this week shows improvement in some areas and not so much in others. On the plus side, we see that the NYSE Composite, NYSE Common Only and Russell "1987" advance/decline lines all completed the week above their series of declining tops that goes back to their early August highs, while the interest rate sensitive advance/decline lines generally remain under selling pressure. One exception to this is comes with the NYSE REIT advance/decline line which also finished the week above its trendline of negative influence. Over in the metals arena, the Precious Metals and XAU advance/decline lines have maintained their buoyancy above their rising trendlines, but this still hasn't translated favorably to either the price of gold or the XAU index itself as both patterns continue to be influenced by their series of declining tops. International issues remain mixed as well, though we do see that both the CAC and DAX advance/decline lines also showed upside breakouts above their negative trends of the last couple of months.
So with the BETS improving to a reading this past week of -30, traders and investors continue to side with a bearish bias with well placed protective stops. Looking at the breadth and volume McClellan Oscillators and we see that all finished on Friday at multi month highs. Large cap issues, in particular, are very strong right now with the Dow and OEX breadth MCO's actually finishing at their highest levels since 1998 according to the data at StockCharts with readings of +169 and +146 respectively. The NYSE Open 10 TRIN has now moved back to a neutral reading of .90, while with the help of a one day TRIN capitulation reading of 2.04 on Thursday, the NASDAQ Open 10 TRIN finished the week in "oversold" territory at 1.06. CBOE and Equity put/call ratios continue to show a 10 day trend of dominate call buying, while according to the Wall Street Sentiment Survey, trader's opinions have become quite bullish since the strong reversal day after the announcement of the CPI data on October 13th. With the market internals deeply "overbought" now, the expectation for at least the first half of the week is for a well deserved pullback to correct this extreme imbalance between buyers and sellers. With some very important economic indicators being released later in the week including productivity and the status of employment, market volatility should remain high as traders prepare for the latest reads on consumer price inflation that will be released on November 10th. Using all these bits and pieces as a guide then, let's take a less defensive stance toward equities for the week ahead, while wrenching up our stops any remaining shorts toward a more neutral market view that's likely to continue going into November's OPEX period on the 18th.
Have a great trading week!
US Equity Markets: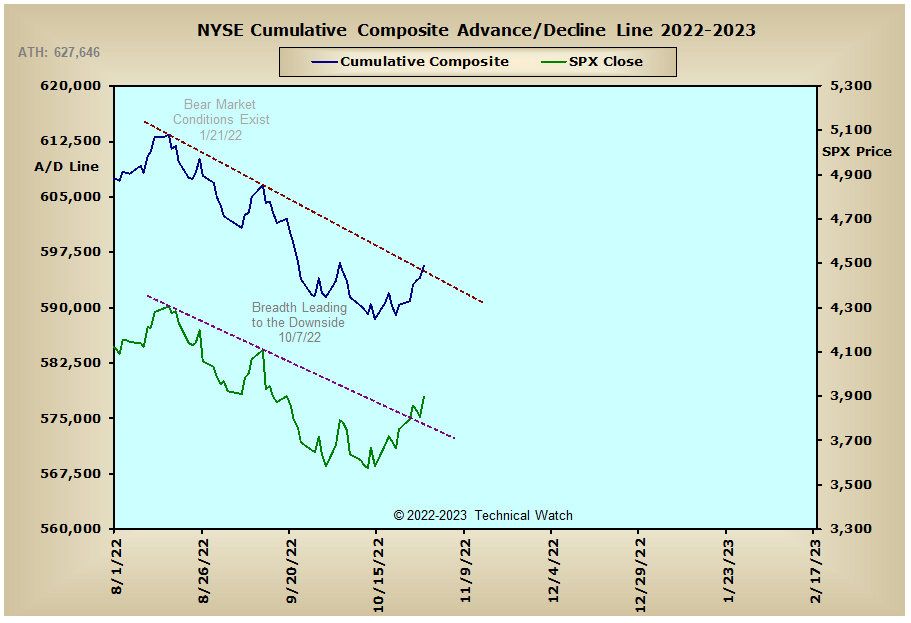

US Interest Rates: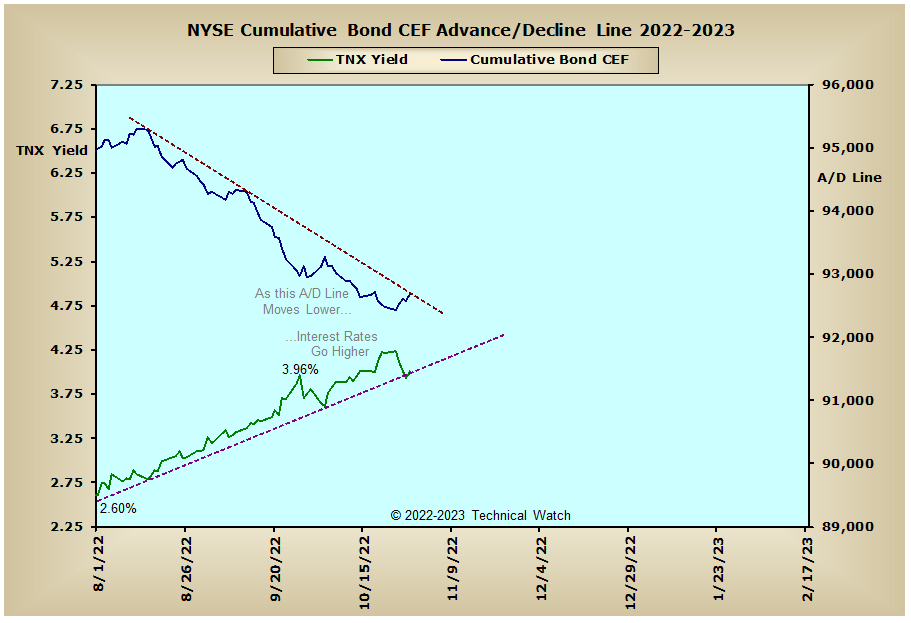
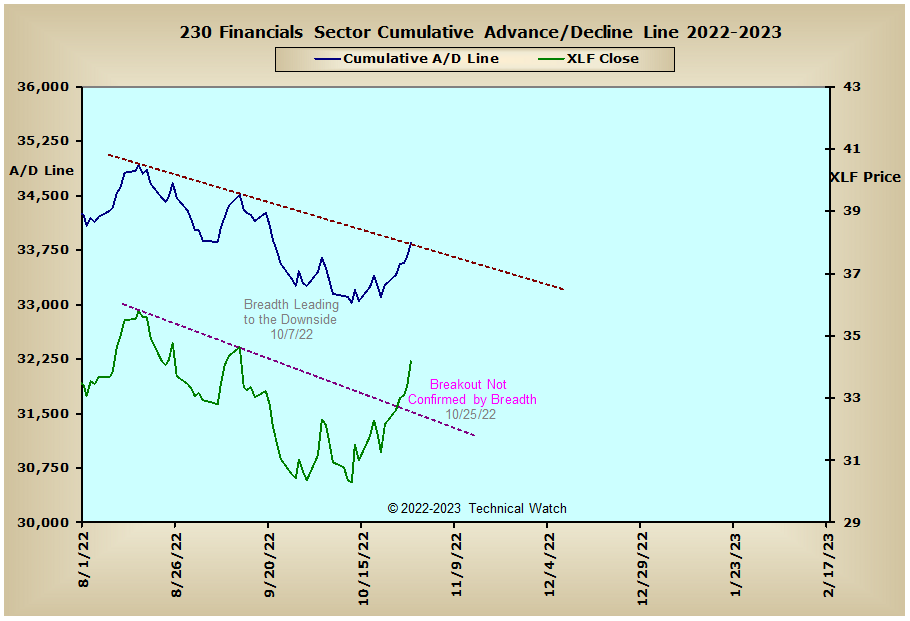
US Sectors: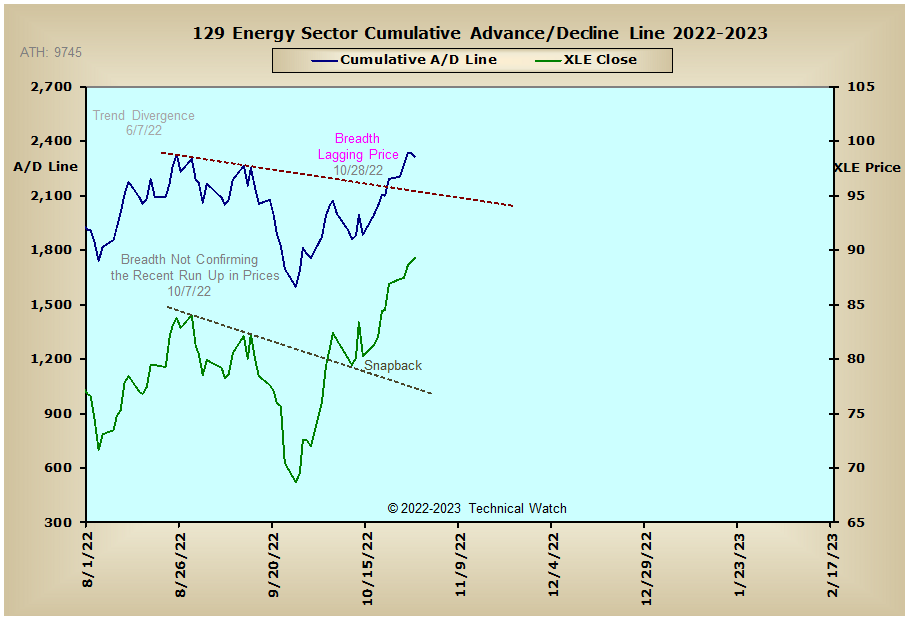
Precious Metals: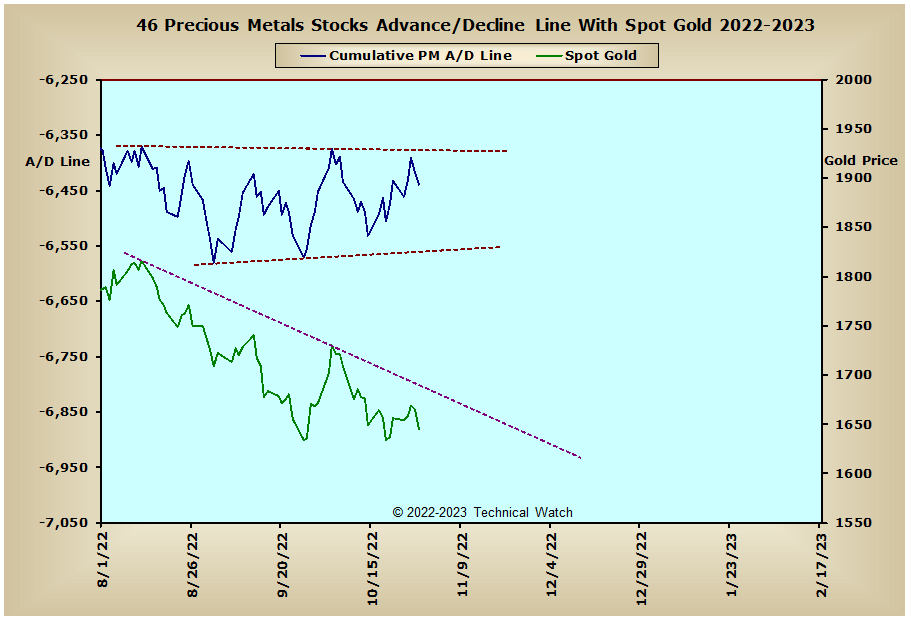
Australia:
England: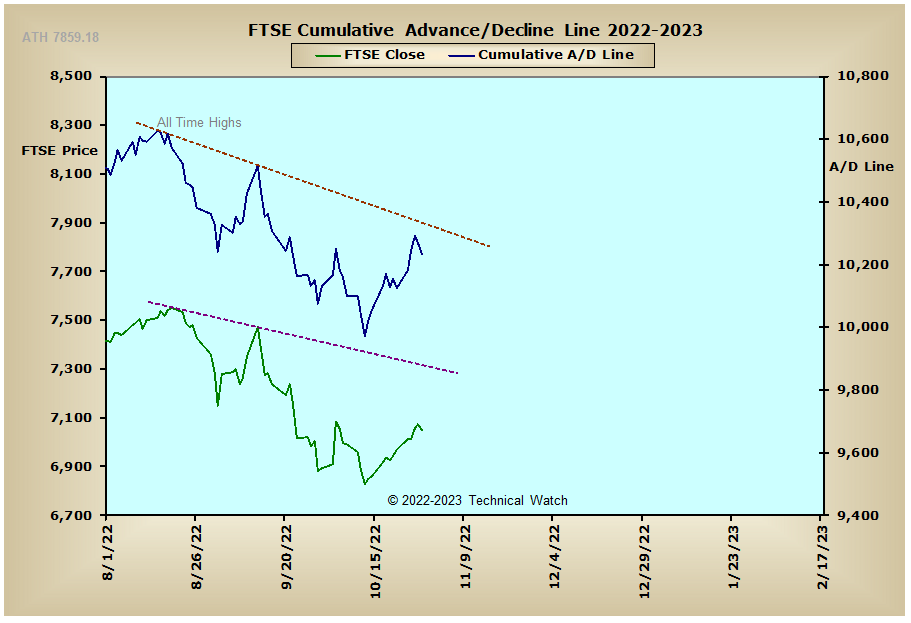
France: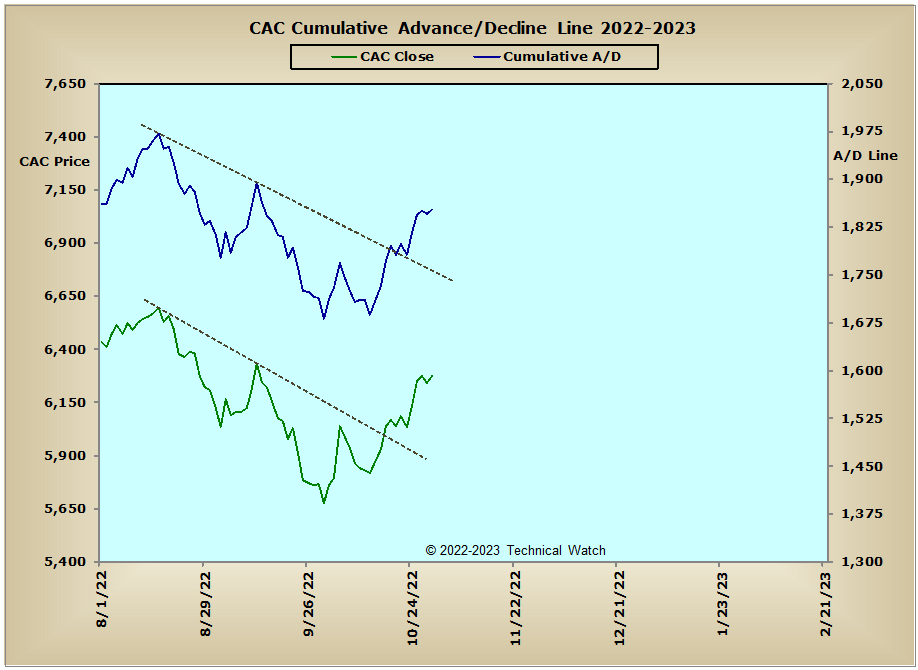
Germany:
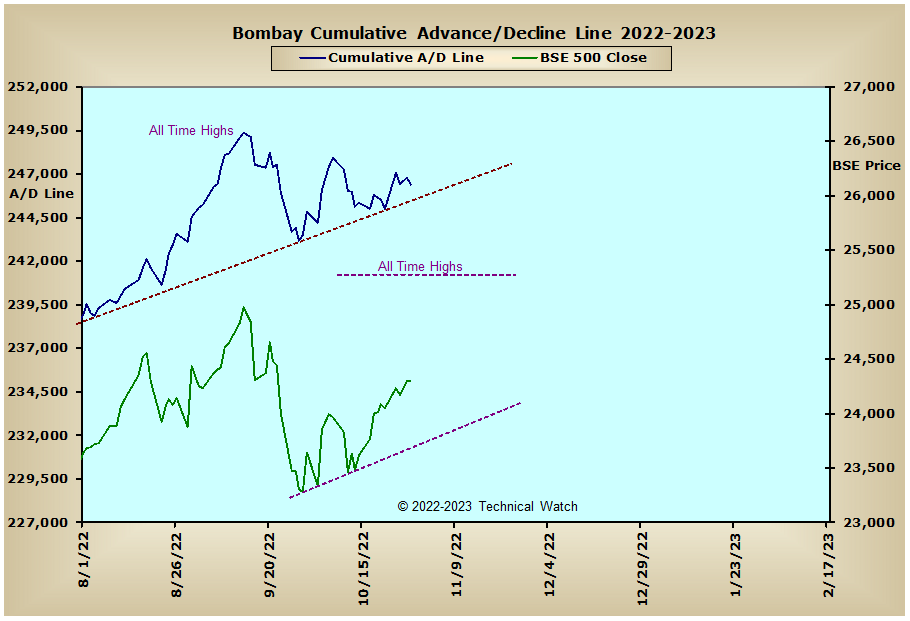
India: