In an effort to bring back technical balance between breadth and volume, the major market indices went on to quickly close the price gaps that were created on June 24th before finishing on Friday with an average weekly loss of -1.94% as the NASDAQ Composite Index provided the thumb on the scale with a loss of -4.13%. For the month of June itself, the equity markets swooned on average by another -8.46% to finish out the 2nd quarter down by -15.58%. At the half way point of 2022, the major market indices are now down by an average of -20.11% from their closing numbers on December 31, 2021. Once again, the growth stocks that make up the NASDAQ Composite Index were the big losers for the first 6 months of the year as the index gave up -29.51% as did the NASDAQ 100 Index in one of the more interesting, if not surprising, analytical anomalies of the year so far.
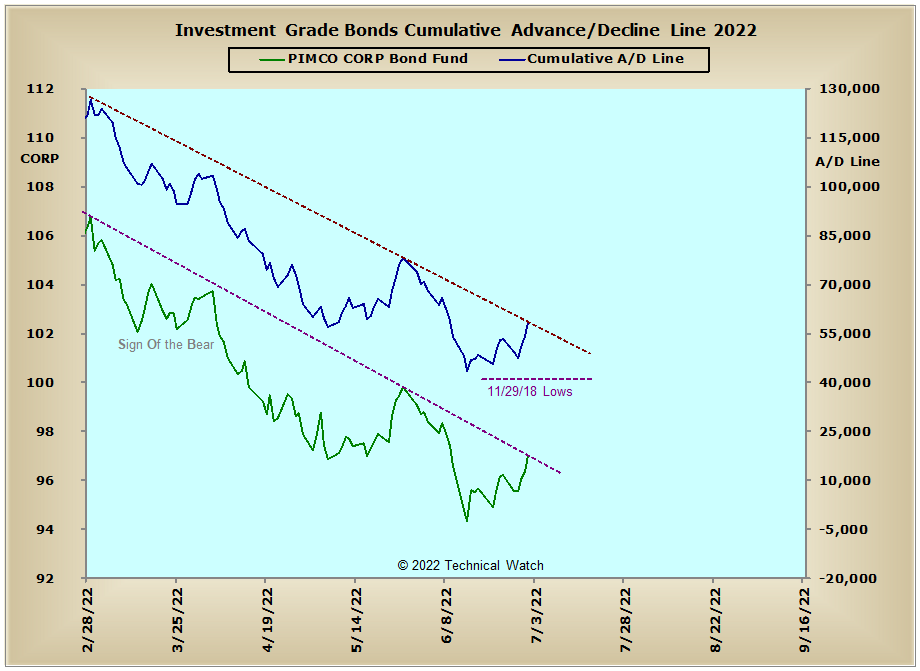
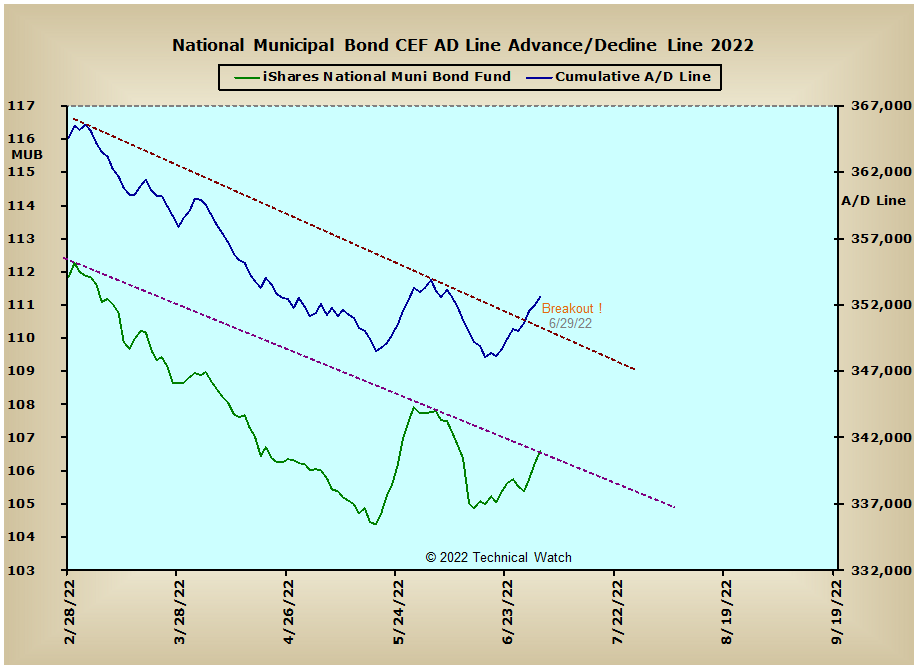
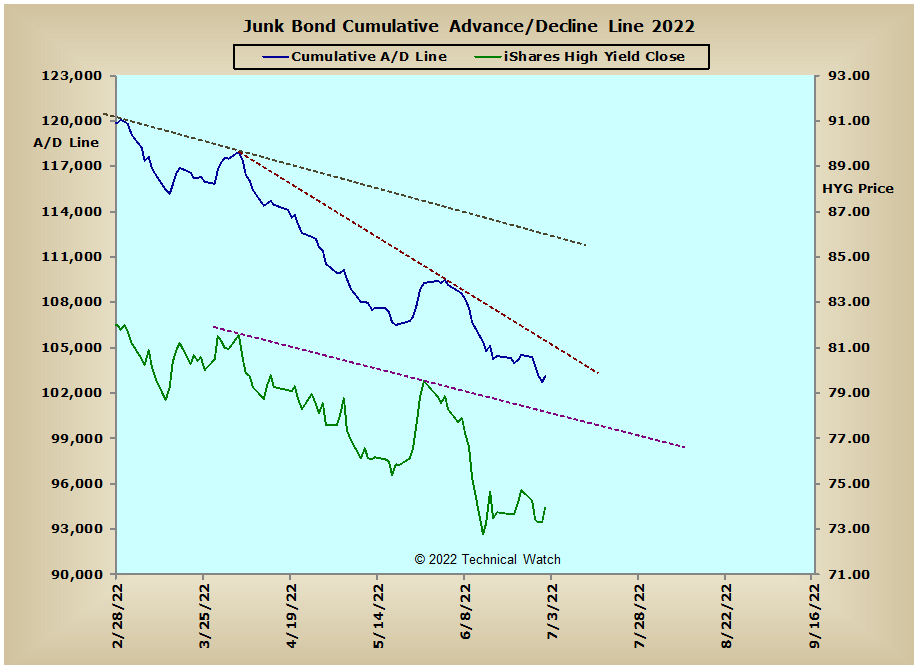
Looking over this past week's standard array of cumulative breadth charts shows that most still remain under the influence of their declining trendlines at this time. We do have some exceptions though as the NYSE Preferred, NYSE Bond CEF and the Municipal Bond advance/decline lines all finished on Friday above these same intermediate term trendlines of resistance, while the Investment Grade Bonds advance/decline line was able to fully snapback to this same multi month line of descending tops. Any further strength over the next week in these same areas of investment would finally provide a time element on when the Federal Reserve might begin to take a more neutral stance toward raising interest rates...maybe as soon as the September meeting. Stay tuned.
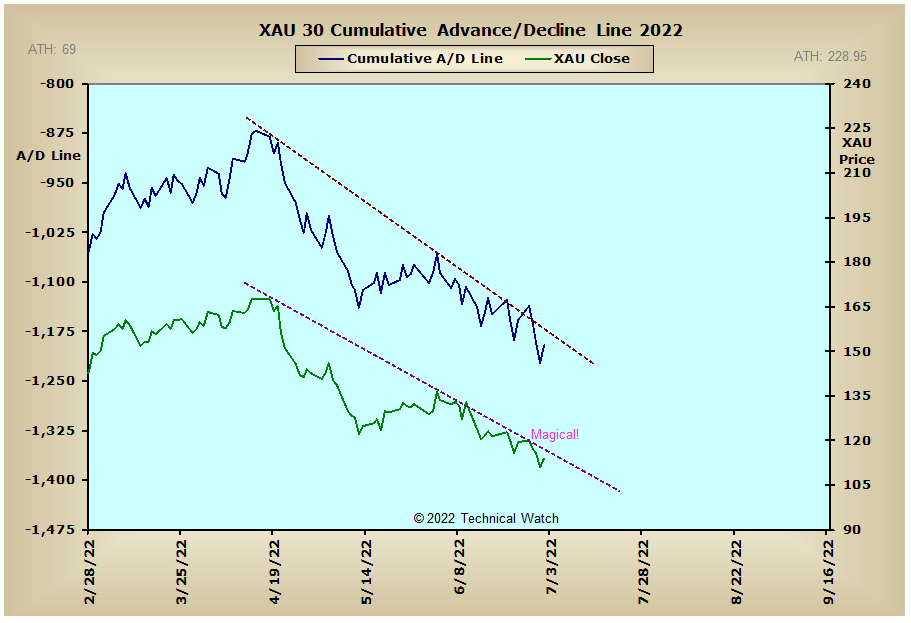
In other areas, the Precious Metals and XAU advance/decline lines continue to sink lower as the price of gold finished on Friday with a breakout to the downside out of a 2 month old pattern of consolidation. With the expectation of further FED interest rate increases going into September, and outside of any obligatory August cyclical bounce, it's looking more and more now that the next real buying opportunity for the metals asset class will come with the cyclical lows of December. Again, stay tuned.
So with the BETS falling back 10 points to a reading of -65, traders and investors are back to a technical sell signal. As we begin the holiday shortened week ahead on Tuesday, the breadth McClellan Oscillators are mixed both in relation to their zero lines and their underlying components. This would suggest that index prices will continue to be stuck in a low level consolidation with the 20 day EMA's providing price resistance. The volume MCO's remain negative in relation to their breadth cousins, and this would suggest that any near to short term surprises will be to the downside. The NYSE Open 10 TRIN finished out on Friday with a reading at 1.37, and this will continue to provide a price floor to any further sideways movement. Both the CBOE and Equity put/call ratios continue to suggest that traders are looking for further recovery in stock prices, while put premiums remain stable at this time. With ADP announcing last week that they will be postponing the next two months of jobs data as they "retool" their indicator, the only potential economic market movers will be Wednesday's PMI report and Friday's jobs numbers for June, with June's Consumer Price Index scheduled for July 13th. With the summer season now upon us, daily trading will likely begin its summer doldrums period until early September. With all this as a background then, let's continue to side with the BETS and remain with a defensive posture toward equities for the week ahead, with the end of the week providing an opportunity for some trading excitement which may include a breakout.
Have a great trading week!
US Equity Markets: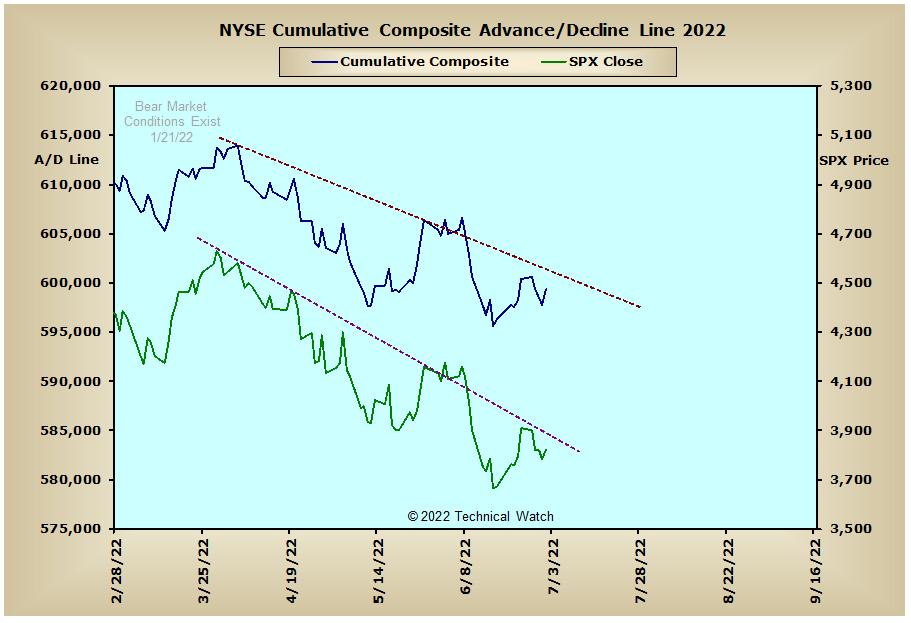


US Interest Rates: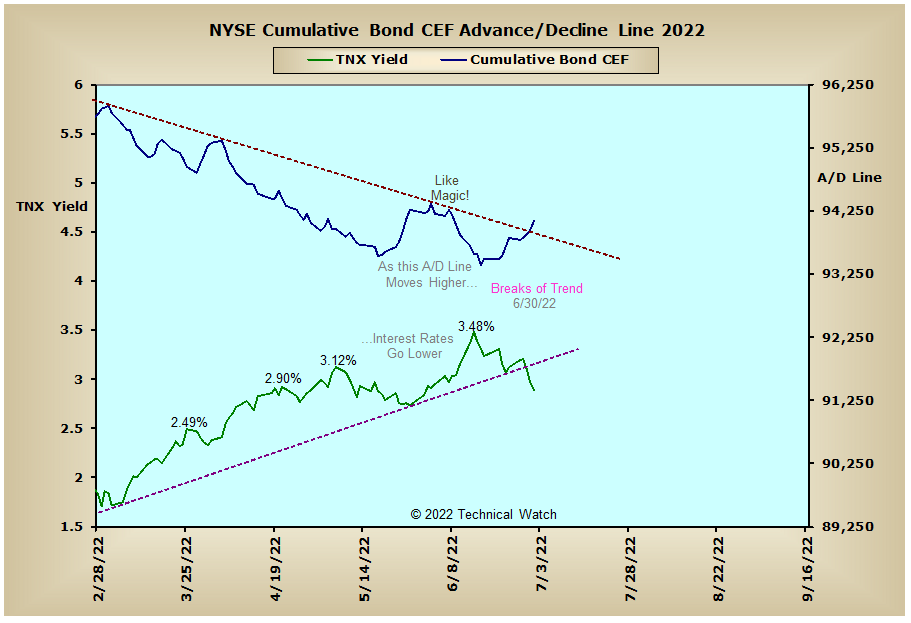
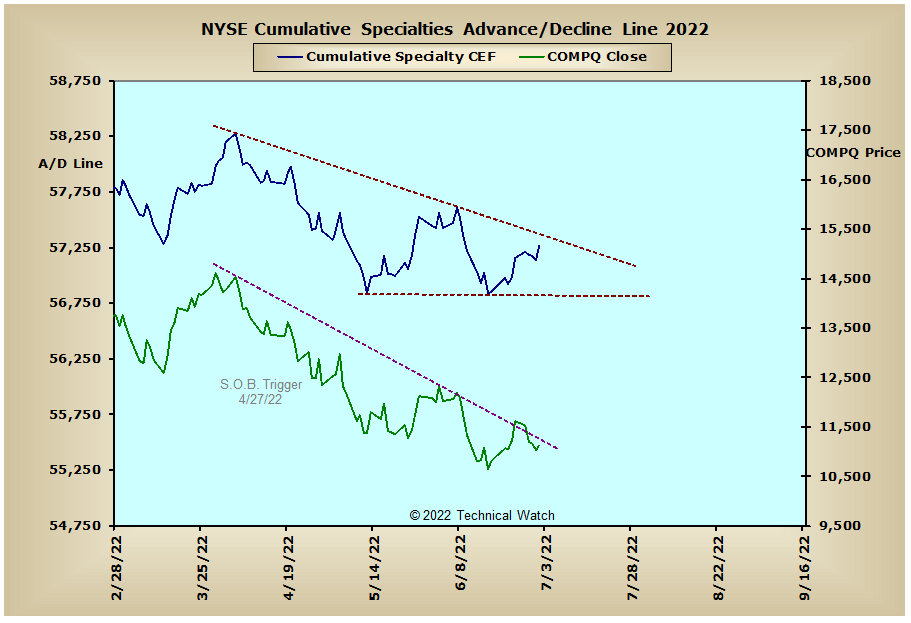
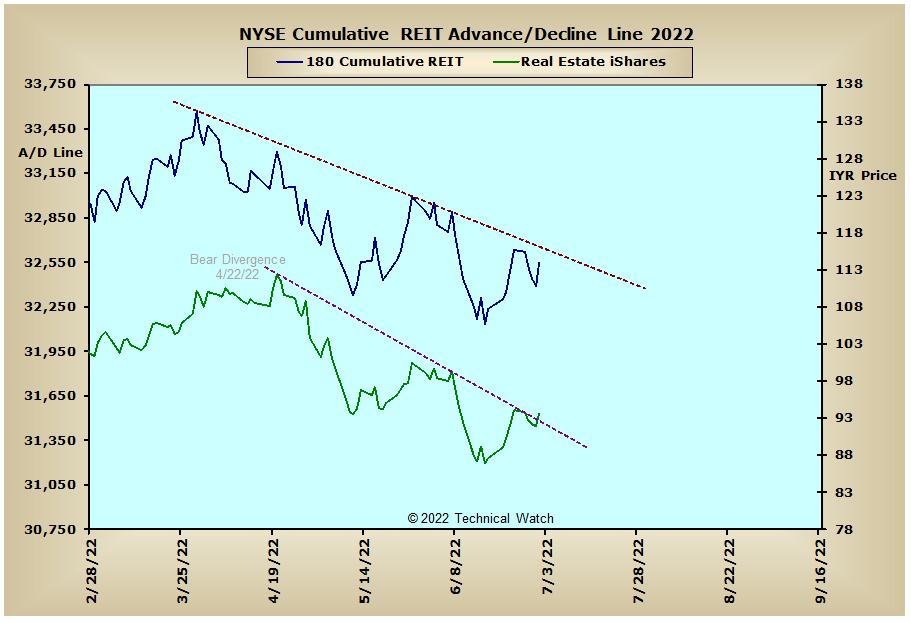
US Sectors:

Precious Metals: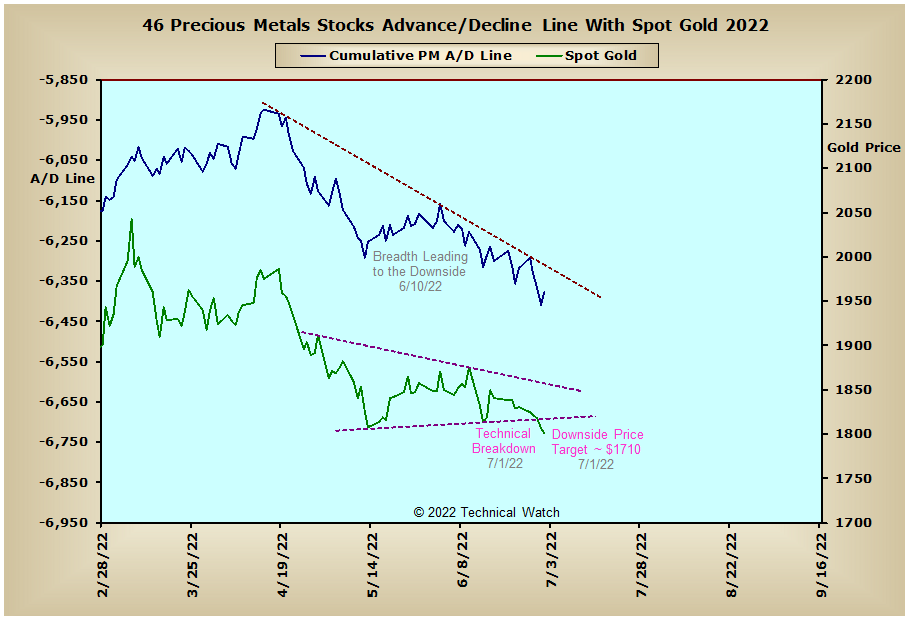
Australia: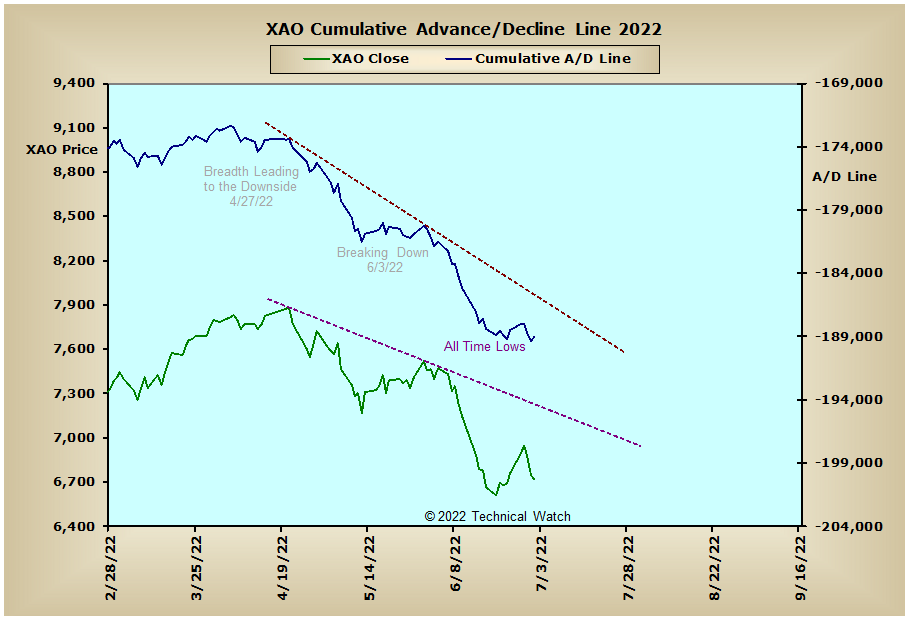
England: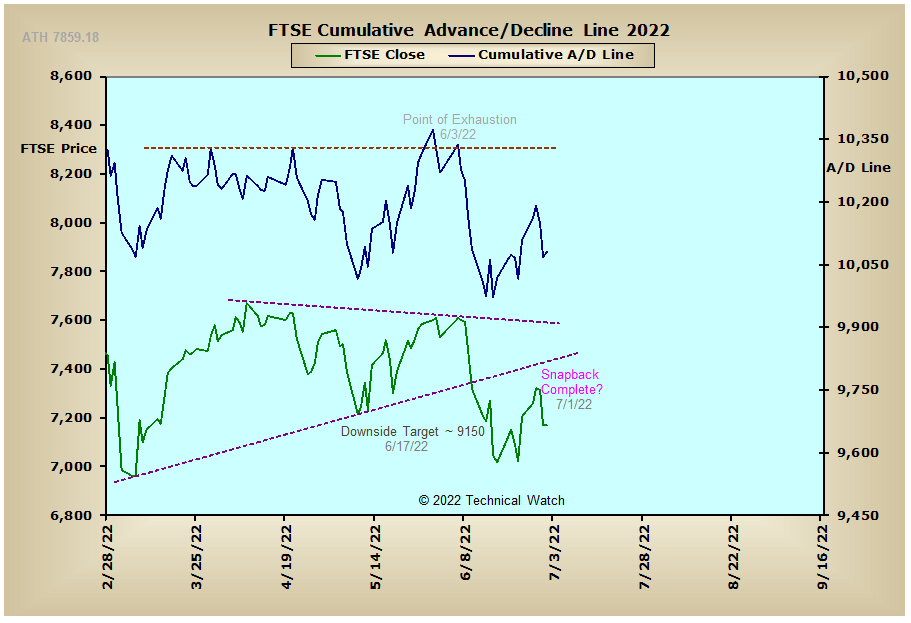
France: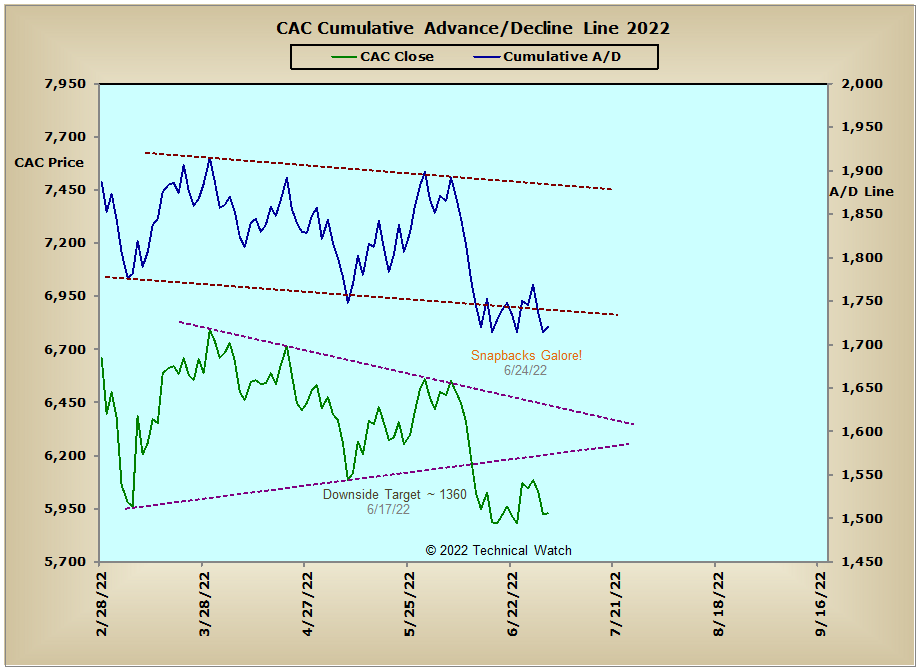
Germany: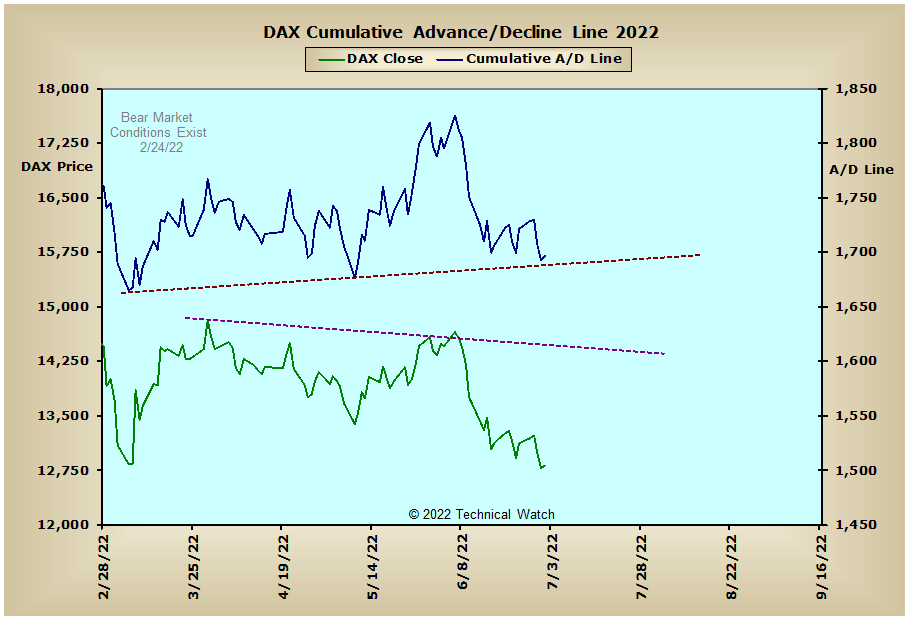
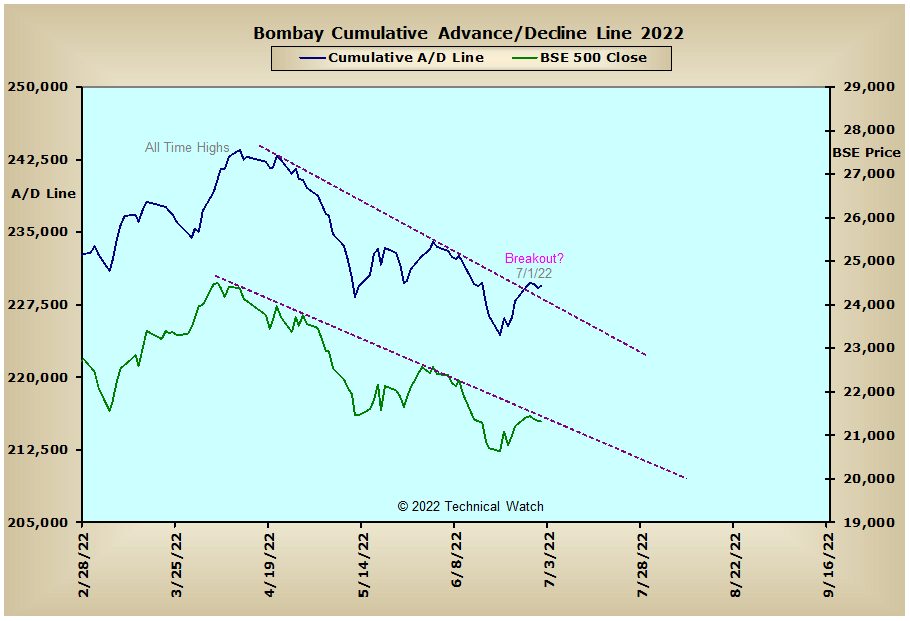
India: