After opening sharply lower on Monday morning, the major market indices then attempted to rally on its internal divergences, but were only able to fill the day's downside price gap before turning lower once again. With Friday's bullish divergences broken on Tuesday, prices then accelerated to the downside as they finished the week with an average loss of -3.87% as growth issues saw the majority of the damage. For the month of August, the losses were slightly greater by -4.02% with the NASDAQ Composite Index taking the biggest hit as it was down by -4.64%.
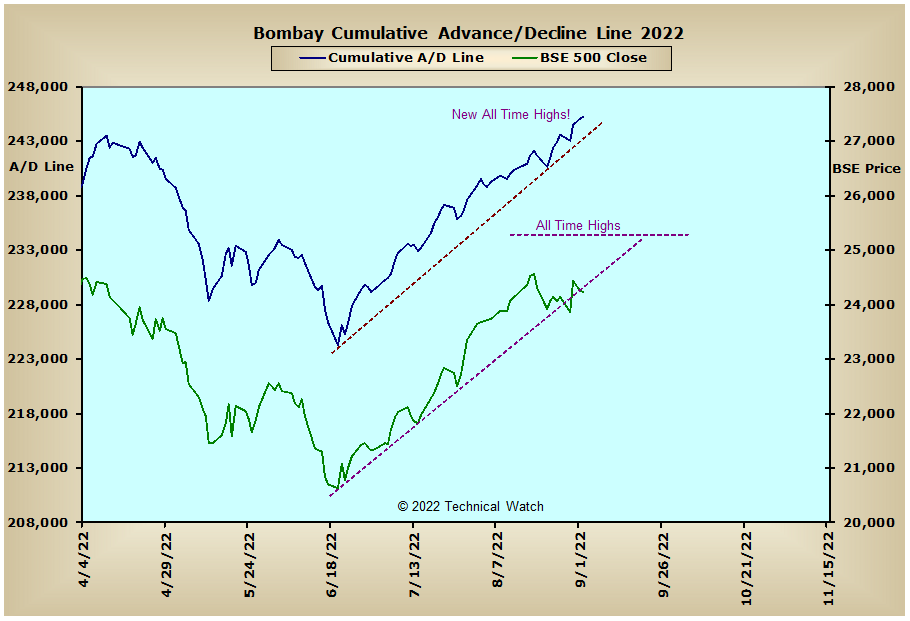
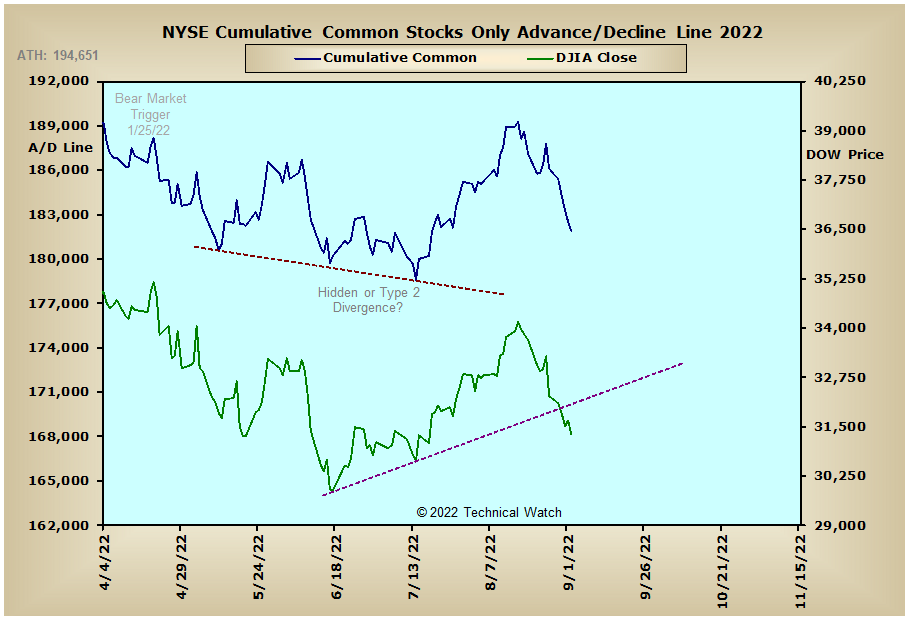
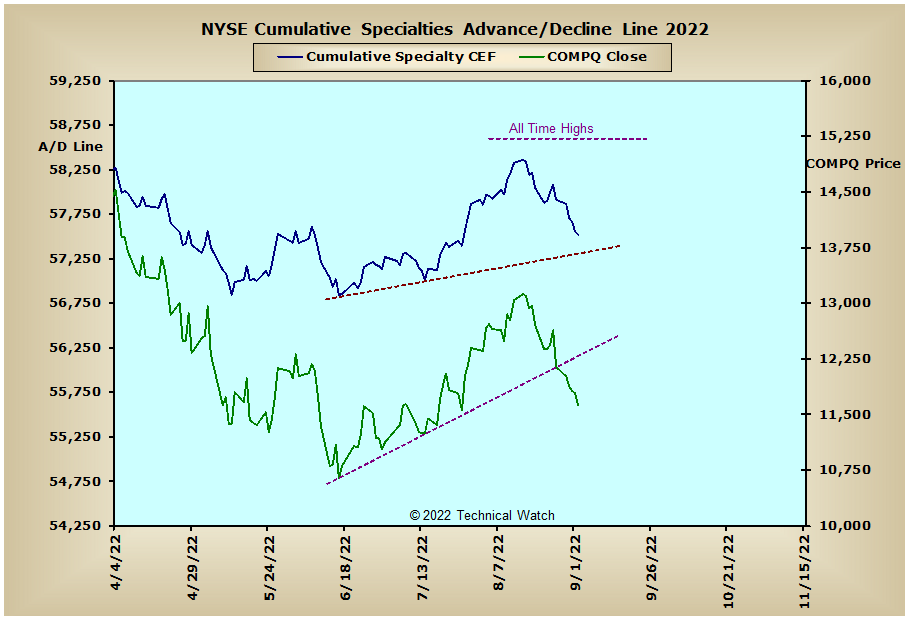
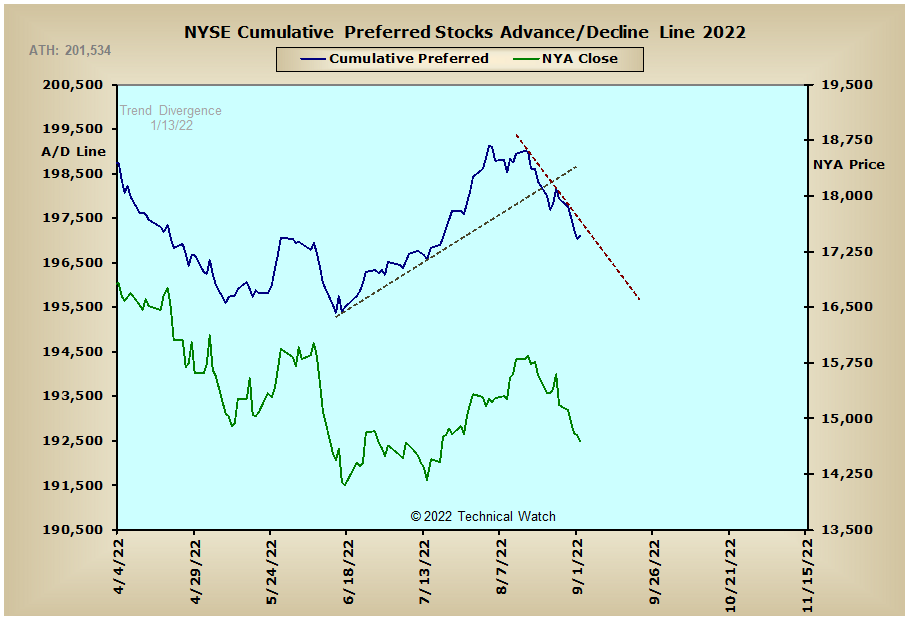
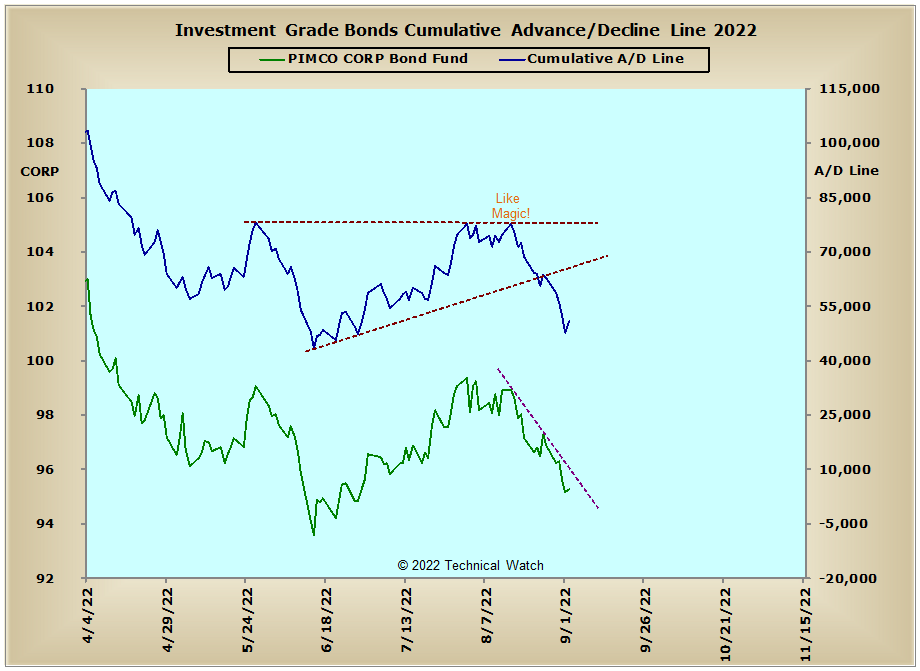
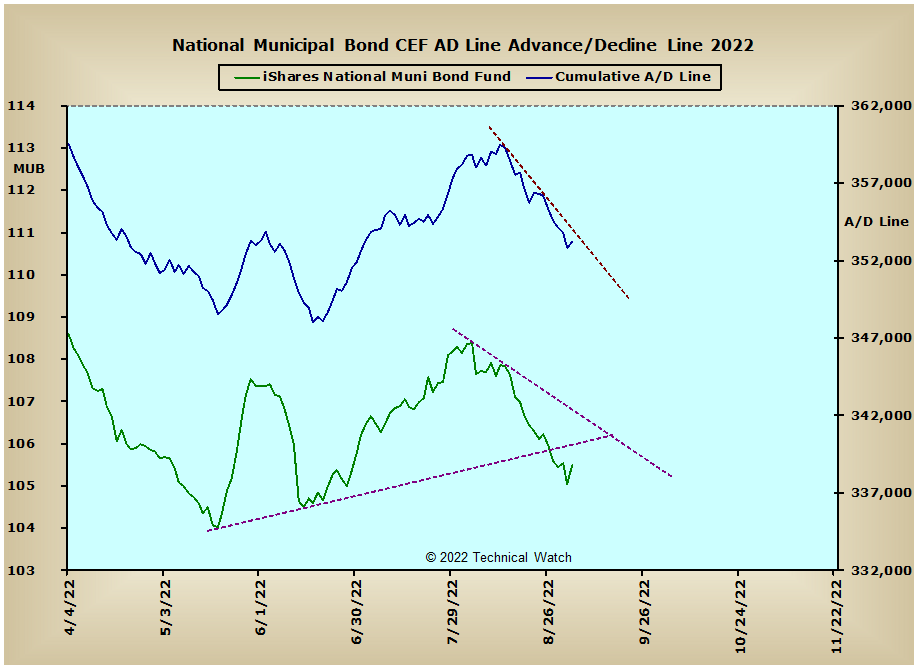
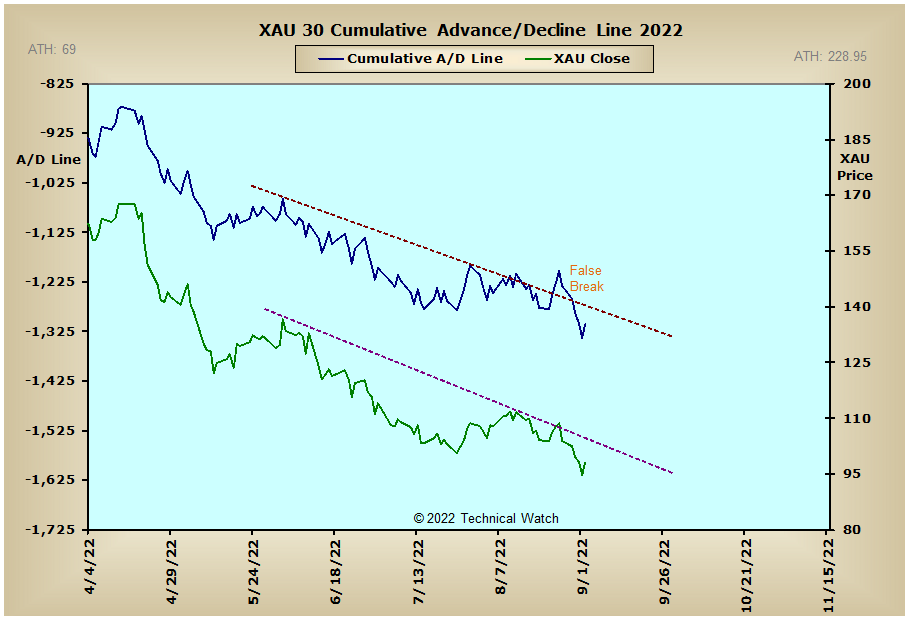
Looking at this week's edition of cumulative breadth charts shows that the NYSE Composite, Common Only, Specialty CEF's and Russell "1987" advance/decline lines continue to remain above their rising trendlines of support that go back to the lows of June and July. Looking at the interest rate sensitive A/D lines also shows that they remain above their June lows in spite of the renewed weakness noted over the last couple of weeks. Both the Precious Metals and XAU advance/decline lines maintain their trends to the downside after finding on going resistance at their intermediate term declining trendlines. Weakness was also noted in the European and Australian markets last week, while the Bombay advance/decline line finished, once again, at new all time highs.
So with the BETS moving sharply lower to a reading of -60, traders and investors continue with their bearish bias toward equities. The big news for the week is that all of the breadth and volume McClellan Oscillators are either challenging or have already made new lows since bear market conditions became prevalent last January. For those who use Elliott Wave analysis in their trading strategies, one of the main characteristics of 3rd wave price structures is that they are always accompanied by higher highs or lower lows in the cumulative advance/decline data of both breadth and volume, and by extension, their momentum measuring tools such as the MCO and MCSUM. With the cumulative advance/decline lines still above their June lows, and having MCO's that are already below or near their lows for the year, this puts us in a bit of a near to short term quandary as to what to expect as the month of September gets underway. What we do know at this time is that those index MCO's that have already made new lows for the year, their respective June price lows will also be taken out over the next couple of weeks with new downside price targets to as low as the COVID crash bottoms of 2020...especially if the cumulative A/D lines of both breadth and volume join the bearish party. Near term, our instrument panel shows that the NASDAQ breadth MCSUM moved down and through its zero line on Friday, while the NDX and Dow breadth MCSUM's will likely do the same as we start things on Tuesday. Looking at the trend of volume, and we see that the NDX, OEX and Dow volume MCSUM's have already crossed back below their zero lines, and this will keep downside pressure on prices for much of the month ahead due to their higher weighted components. Current Open 10 TRIN readings are still not indicative of a tradable low, while put/call ratios remain rather tepid in spite of last week's negative technical and fundamental action. So putting this all together then, investors can now put their money to work by either shorting or using inverse ETF products that take advantage of lower prices, while traders can now have more of a bearish bias in their day to day trading methodologies.
Have a great trading week!
US Equity Markets: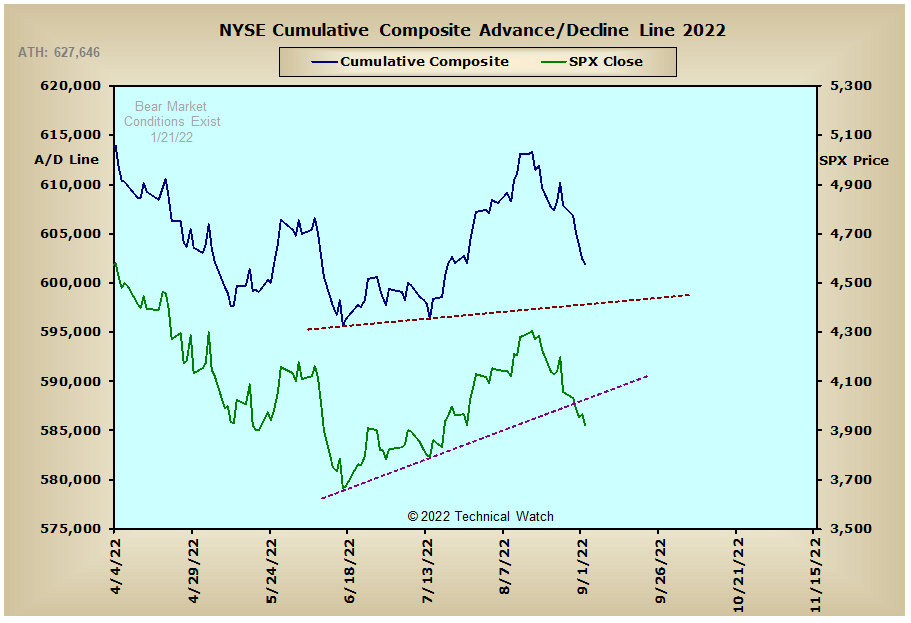

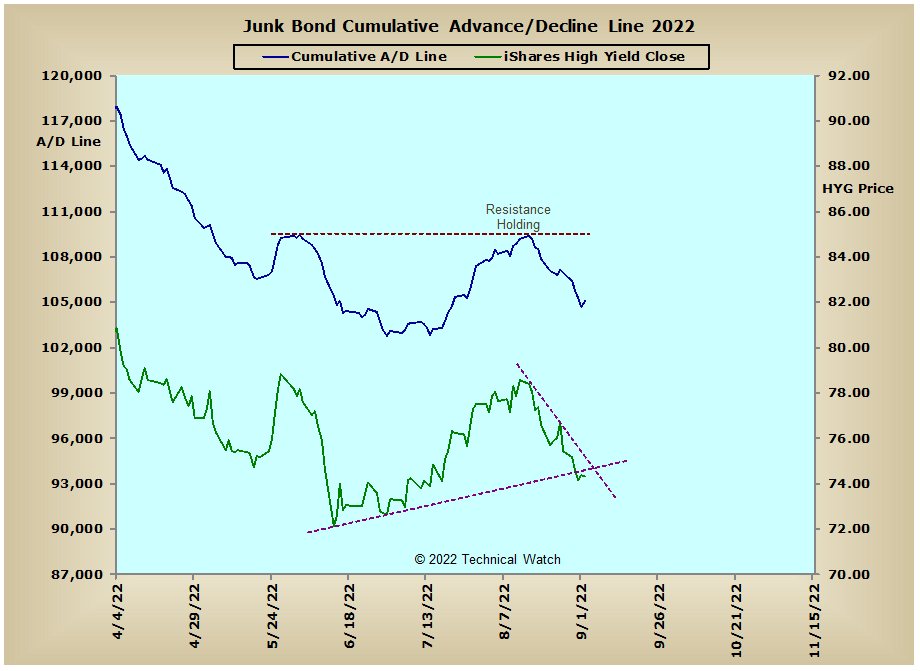
US Interest Rates: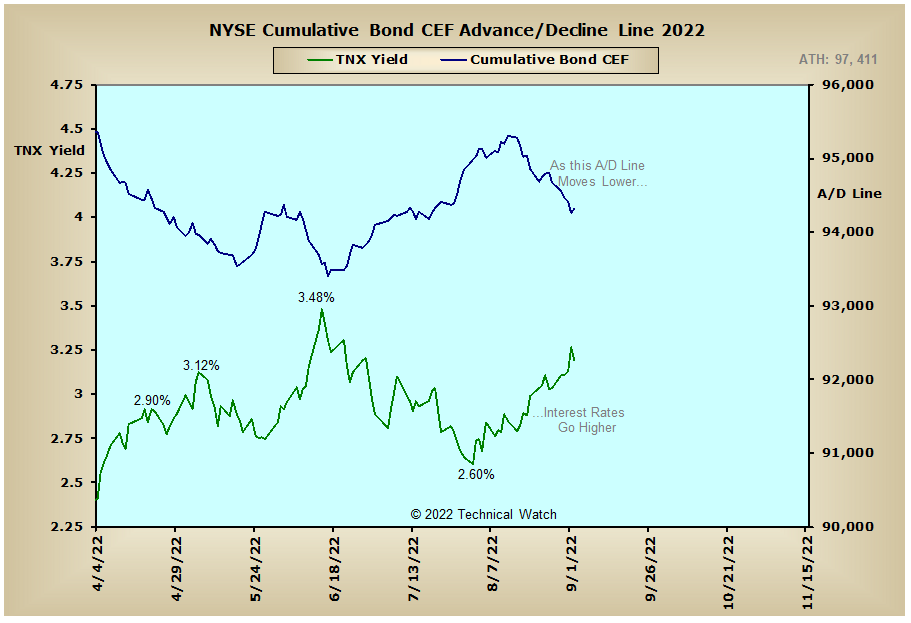
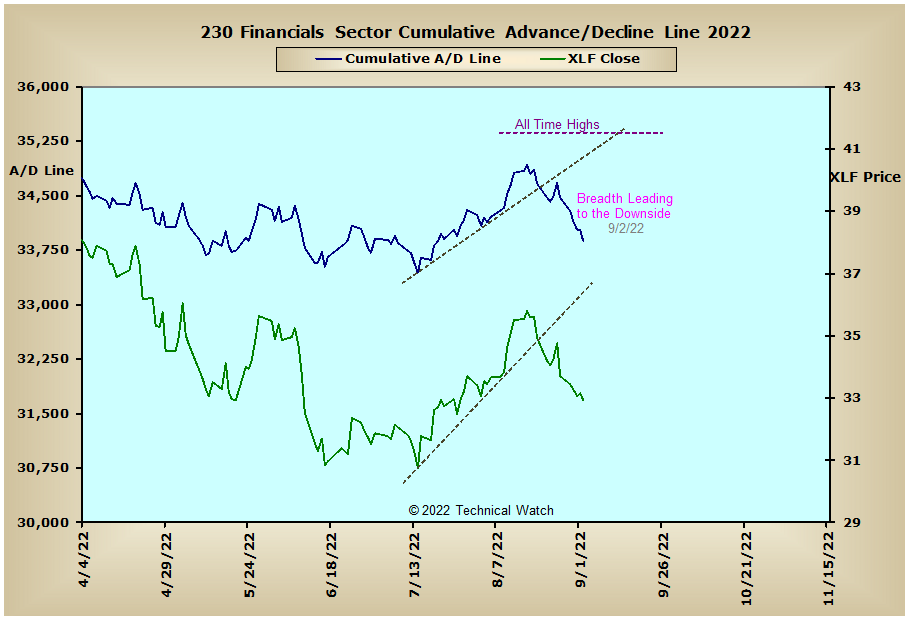
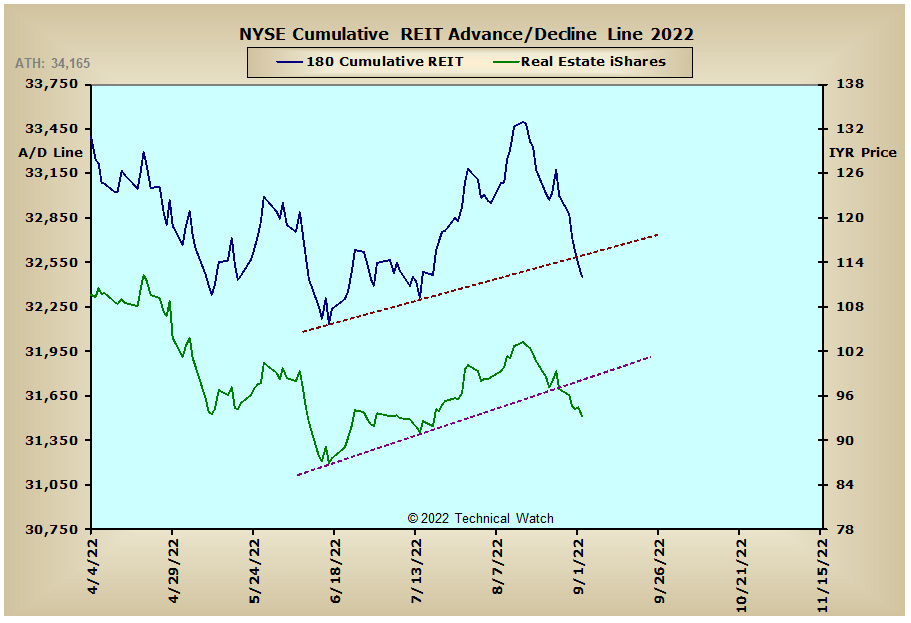
US Sectors: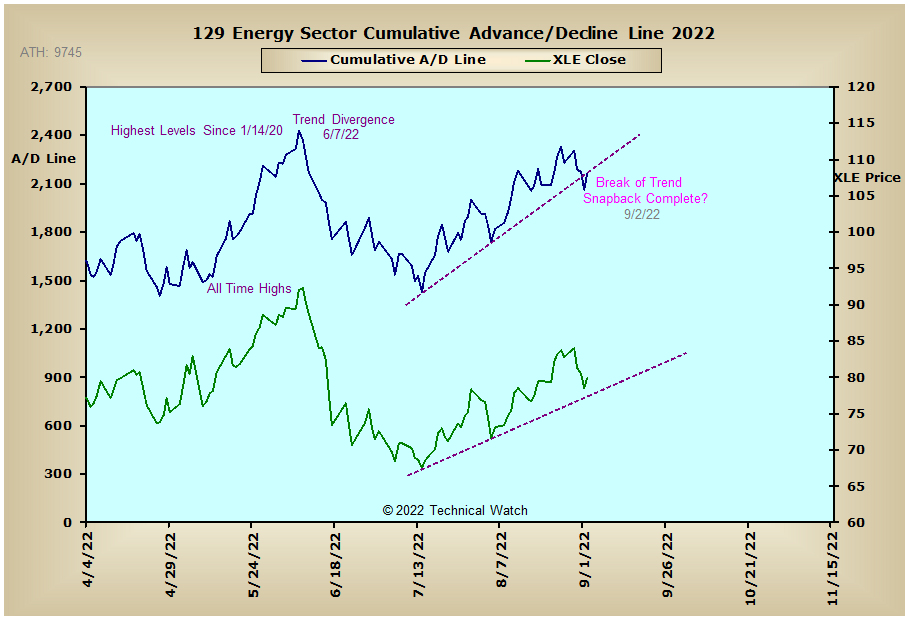
Precious Metals: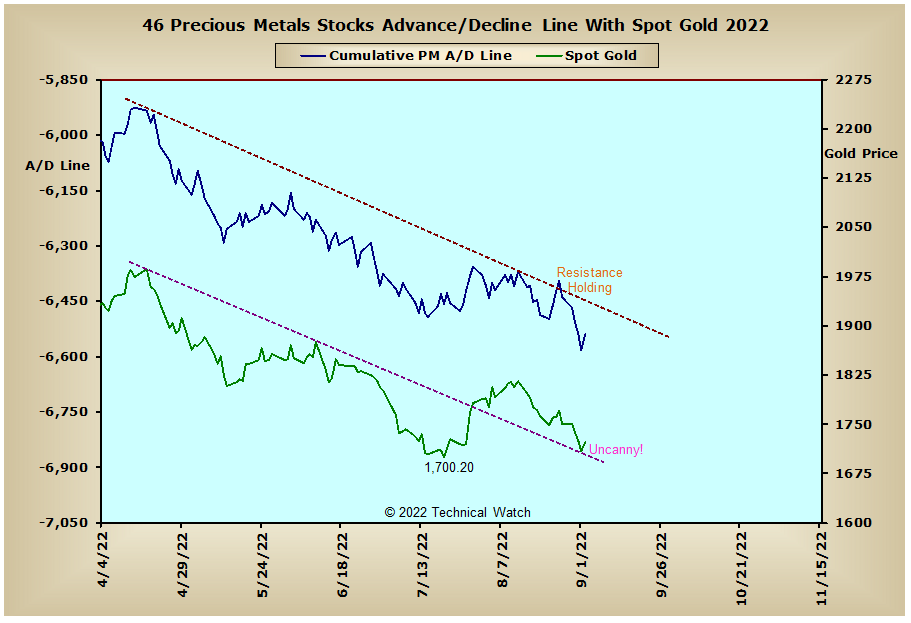
Australia: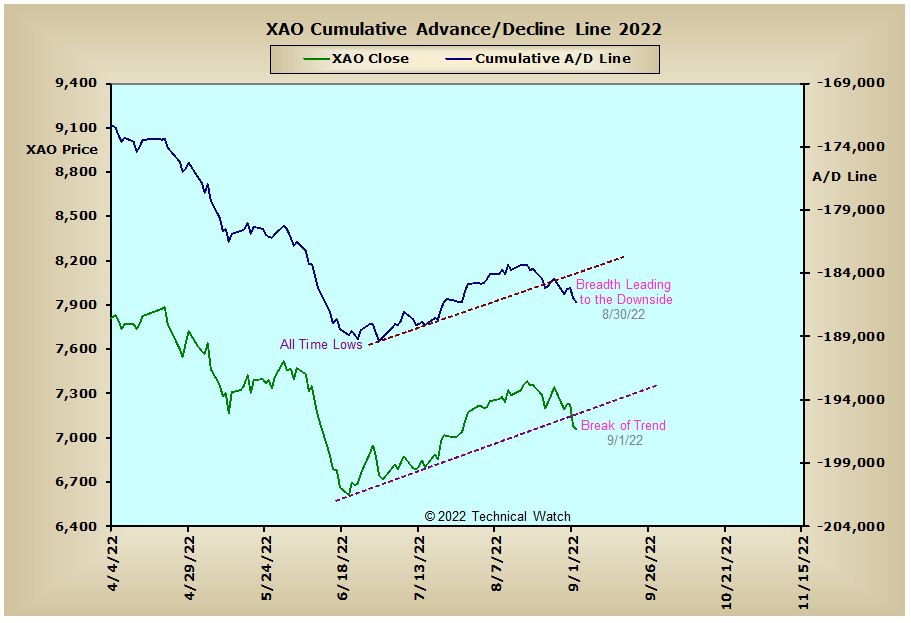
England: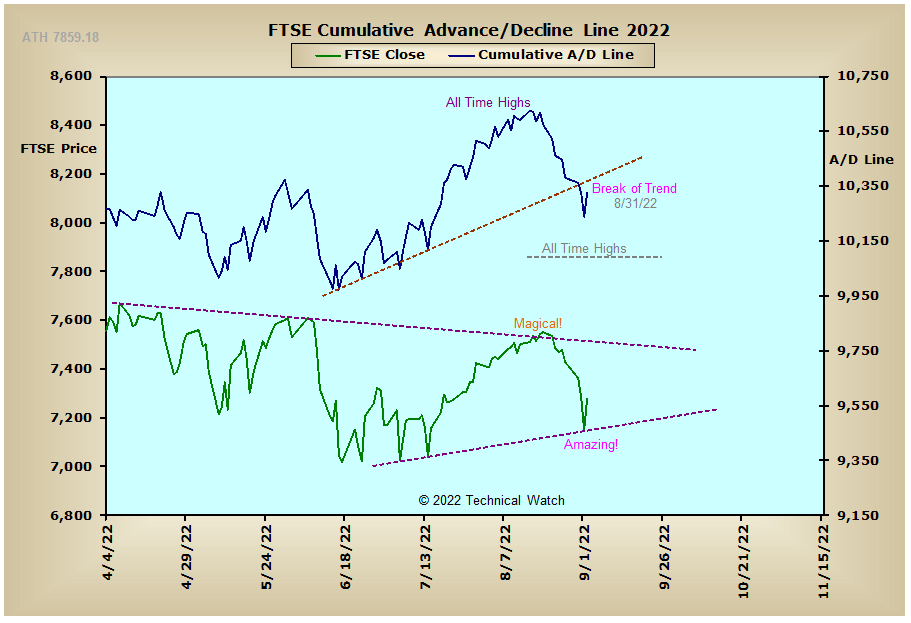
France: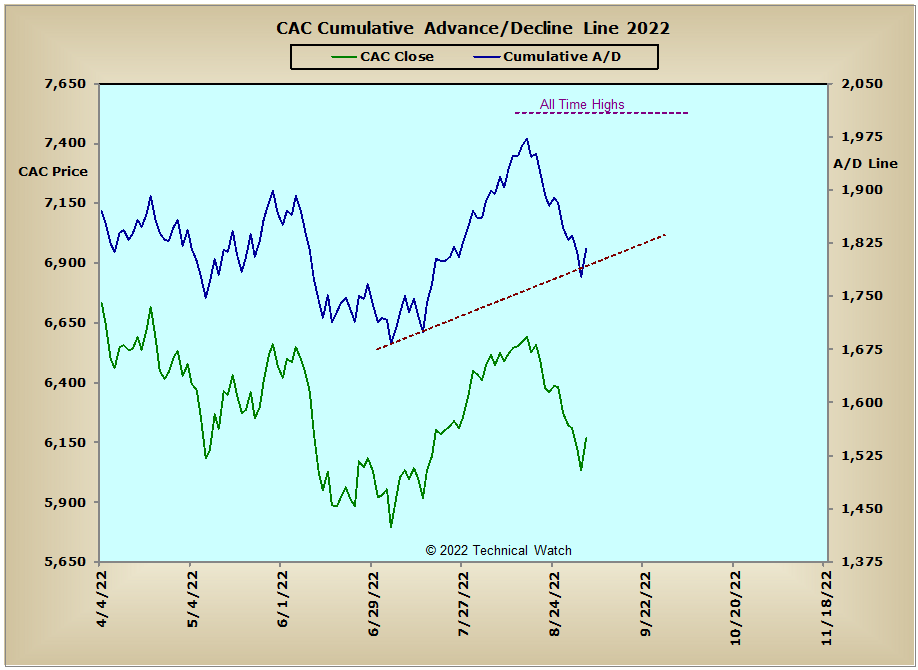
Germany: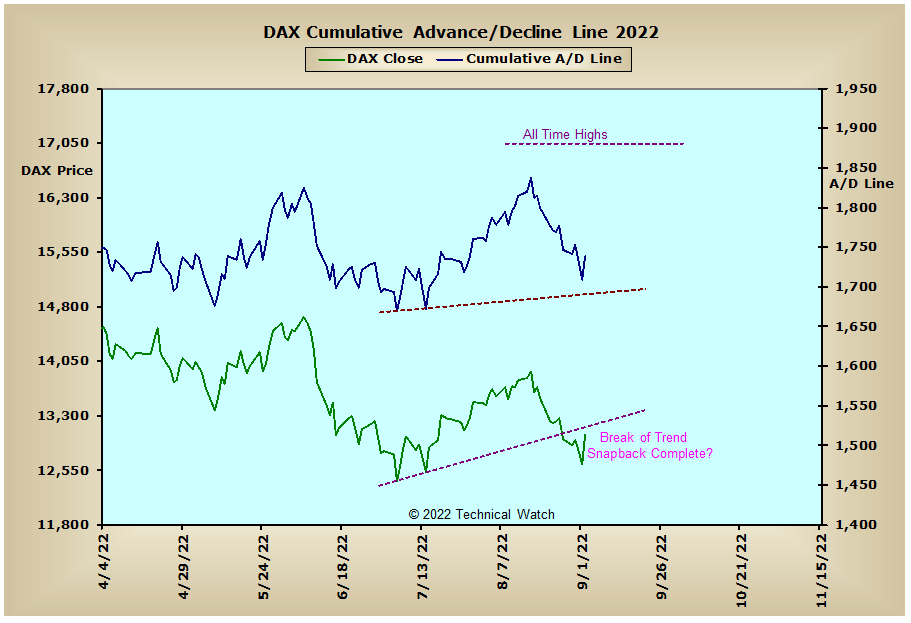
India: