Jump to content


Photo

Did Terry's Magic "T" call it months ago?


  • Please log in to reply
8 replies to this topic

#1 Rogerdodger

Rogerdodger

    Member

  • TT Member*
  • 26,870 posts

Posted 09 September 2022 - 08:43 PM

Honestly, I forgot this chart that I drew in late June until I saw it again tonight.

It seemed to pinpoint today's rally months ago.

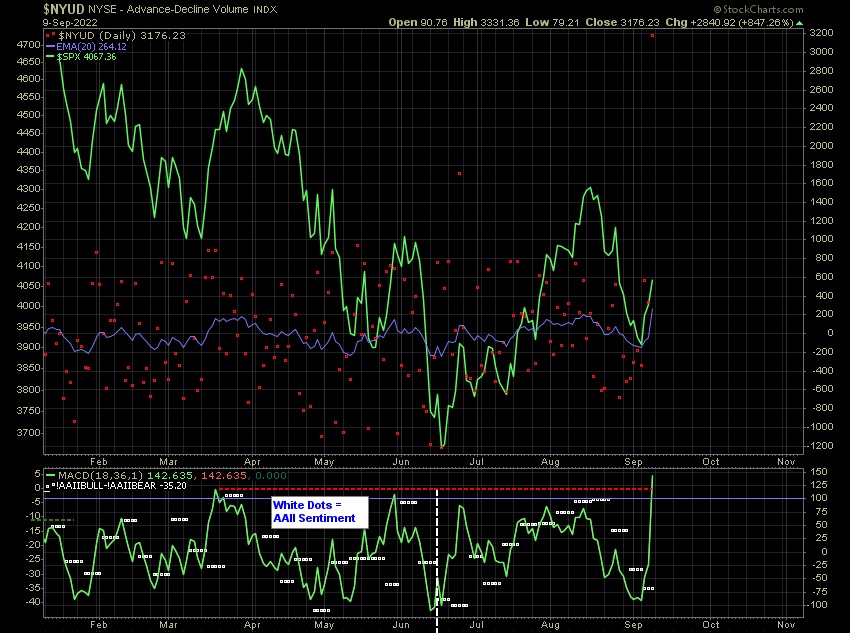
It uses the MACD of the $NYUD (seen in bottom indicator chart).

MACD highs of $NYUD are marked and then measured to $NUYD low to estimate a conclusion date to the "Magic T".

Twin lows such as we had in mid June are marked from the center point of the two.

I admit that there can be more nuances to Magic T Theory, but I'm a simple horse shoes and hand grenades type of guy.


For more info, see: https://ttheorygroup.science.blog/

T-Theory Thoughts

A place for the old and slow to reach investment decisions, dedicated to the teachings of Terry Laundry


PS: Ignore today's $NYUD as these numbers are likely not final.


T-Theory-rally-9-9-22.jpg


Edited by Rogerdodger, 09 September 2022 - 08:45 PM.


#2 Douglas

Douglas

    Member

  • Traders-Talk User
  • 1,826 posts

Posted 10 September 2022 - 06:07 AM

Rodgerdodger, the fellow at the Ttheory website that sort of unofficially took over from Terry publishing Magic "T" projections (ttheorygroup.science.blog) is showing a Bear "T" with a low predicted for this coming Tuesday September 13th, see ($NYUD | SharpCharts | StockCharts.com).  As you noted the data shown for yesterday is incorrect at Stockcharts.com.  The actual advance-decline delta yesterday was 677 which would create a much lower MACD value than shown. 


Of course, it is possible that the actual low came in a bit early on September the 6th and maybe a higher low will occur on Tuesday, or maybe even a high, but we'll know for sure in just a couple of days.


odvdY2a.png


Regards,

Douglas


Edited by Douglas, 10 September 2022 - 06:12 AM.


#3 Rogerdodger

Rogerdodger

    Member

  • TT Member*
  • 26,870 posts

Posted 10 September 2022 - 10:23 AM

Thanks. That larger chart does a better job of picking a precise measurement and date.

It looked like it was going to be a "Bear T" if anything.

T Theory, counting waves, Gann etc. are just curiosities to me.

It seems that if enough people are following those "tools" they could become self-fulfilling.

I think that their usefulness waned decades ago with the advent of computer trading and machine learning programs.

But what do I know.


#4 redfoliage2

redfoliage2

    Member

  • Traders-Talk User
  • 18,000 posts

Posted 12 September 2022 - 11:09 AM

Well, NYAD down a little bit today amid the gains in SPX ............................


Edited by redfoliage2, 12 September 2022 - 11:15 AM.


#5 K Wave

K Wave

    Member

  • Traders-Talk User
  • 26,649 posts

Posted 13 September 2022 - 08:13 AM

Did Sep 13 "Nail It"?


Sure looking like possible top here after CPI "news"


The strength of Government lies in the people's ignorance, and the Government knows this, and will therefore always oppose true enlightenment. - Leo Tolstoy


#6 Douglas

Douglas

    Member

  • Traders-Talk User
  • 1,826 posts

Posted 13 September 2022 - 08:25 AM

Now I'm stumped as to what Terry's "T" signalled.  The Ttheory website that I noted above (ttheorygroup.science.blogspot) changed the wording on the note for today's "T" termination getting rid of the "bear" label, so did the "T" point to the premarket top today, or is it pointing to a low of some sort that might form based on futures action.  Bear or bull "T", one thing is for certain, the "T" said something was going to happen today and boy was that ever on target.  


Regards,

Douglas


#7 bunker

bunker

    Member

  • Traders-Talk User
  • 29 posts

Posted 13 September 2022 - 04:15 PM

You can always read the full post here:

https://wordpress.co...ience.blog/2047

;)


#8 Douglas

Douglas

    Member

  • Traders-Talk User
  • 1,826 posts

Posted 13 September 2022 - 05:07 PM

bunker, thanks for reminding me to read the "Posts" and not just look at the T Theory Chart.  If you are the one maintaining that site, thanks doubly.  I was an avid follower of Terry's work for many years.  When I read the "Posts", I was heartened to learn that I wasn't the only one confused about what was going on with that "T" ending today.  


Regards,

Douglas


#9 bunker

bunker

    Member

  • Traders-Talk User
  • 29 posts

Posted 13 September 2022 - 10:20 PM

Yes that’s my site. I’m glad tomorrow is the day after. There is still the possibility of that new T through October 6 as the McOsci closed near the zero line and the VO will be adjusted tomorrow sometime. Terry mentioned in one of his audios that Marty Schwartz showed him that the VO almost always returned to the zero line after creating a new T. I’m just glad this last one is over.