After seeing continued follow through selling after the long Labor Day weekend on Tuesday, the major market indices reflexed sharply from their deeply "oversold" levels for the rest of the week to finish on Friday with a average weekly gain of +3.50% and breaking its 3 week losing streak. Leading the recovery was the S&P 400 Mid Cap Index which finished higher by +4.39%, while the S&P 600 Small Cap Index brought up the rear as it added +2.74%.
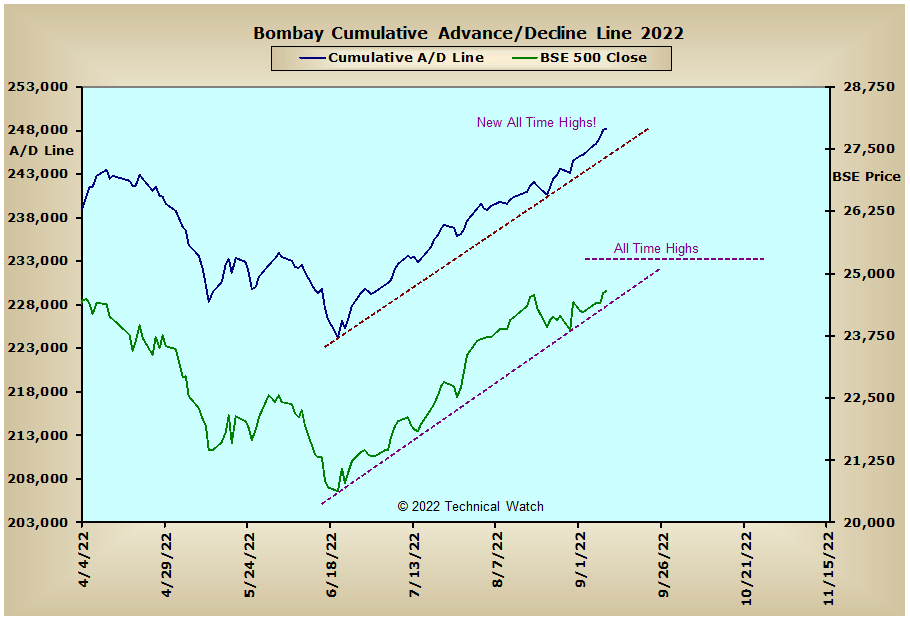
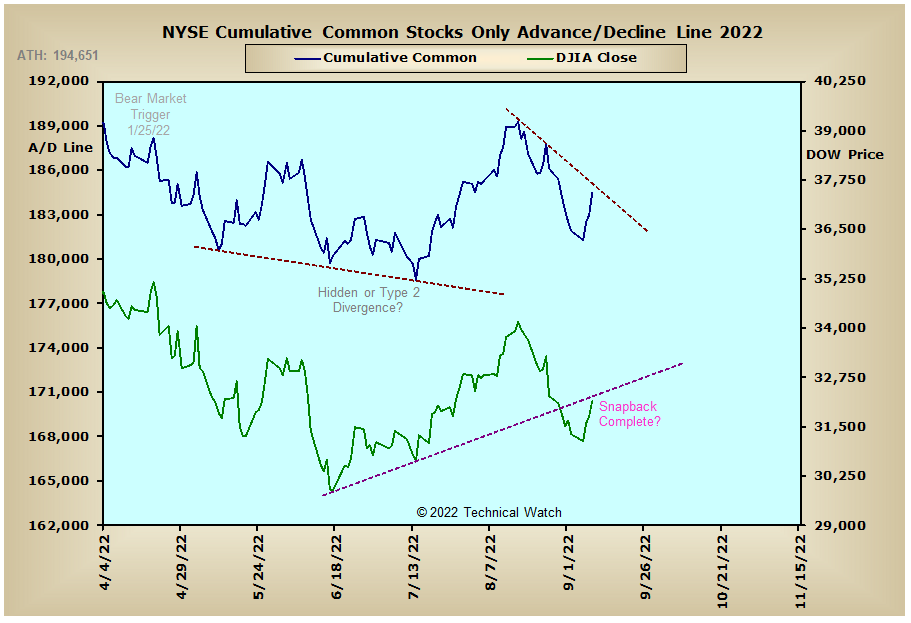
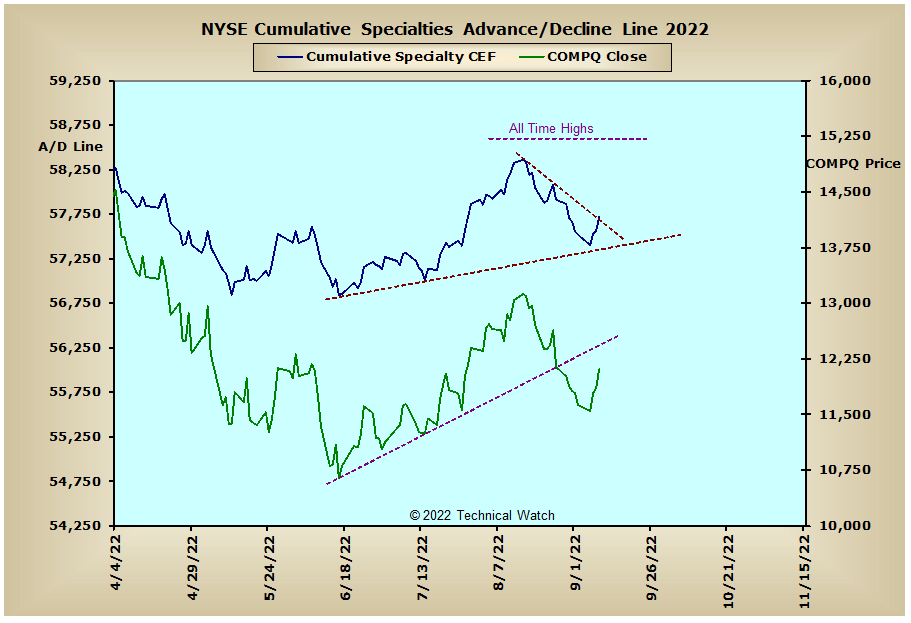
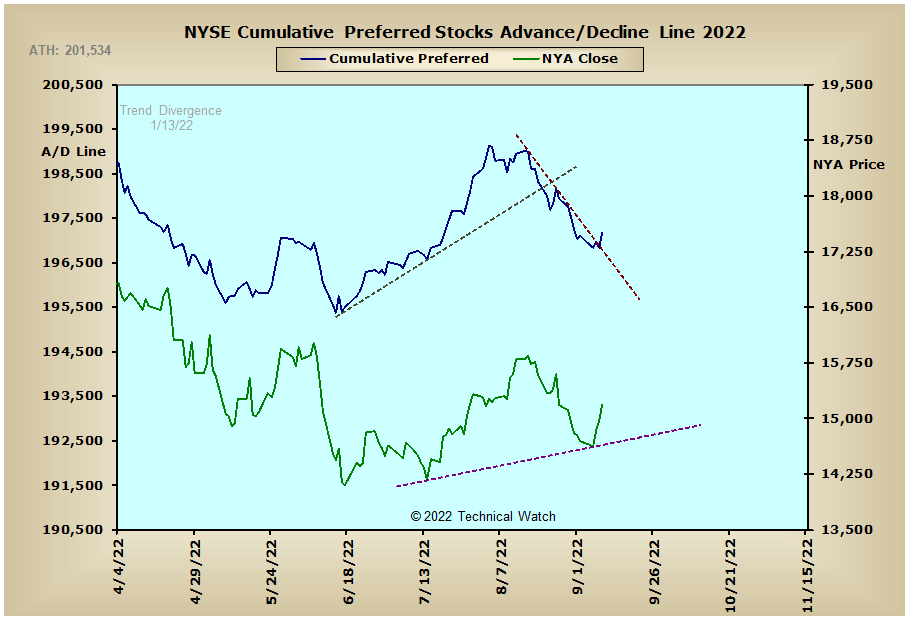
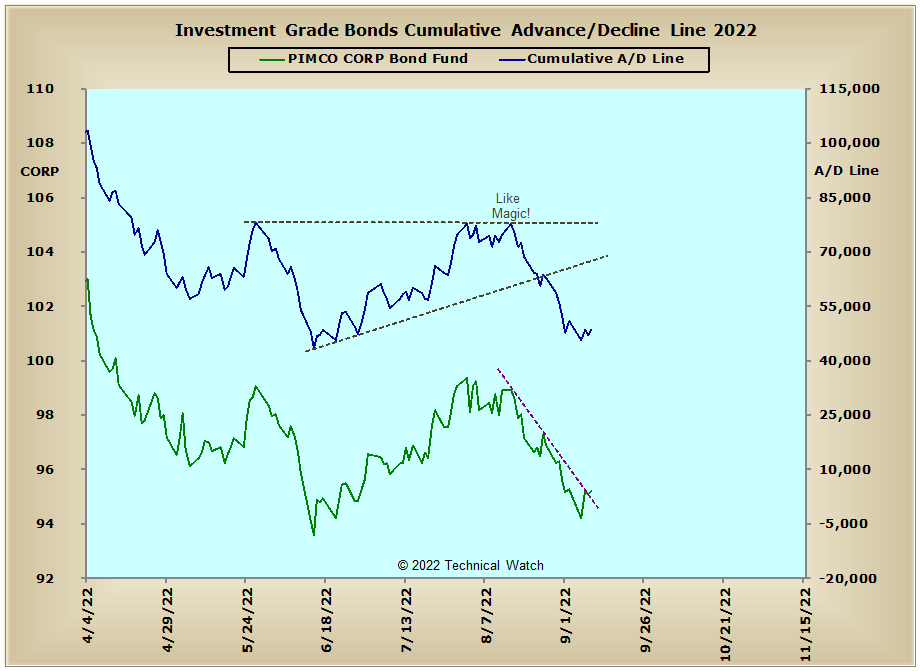
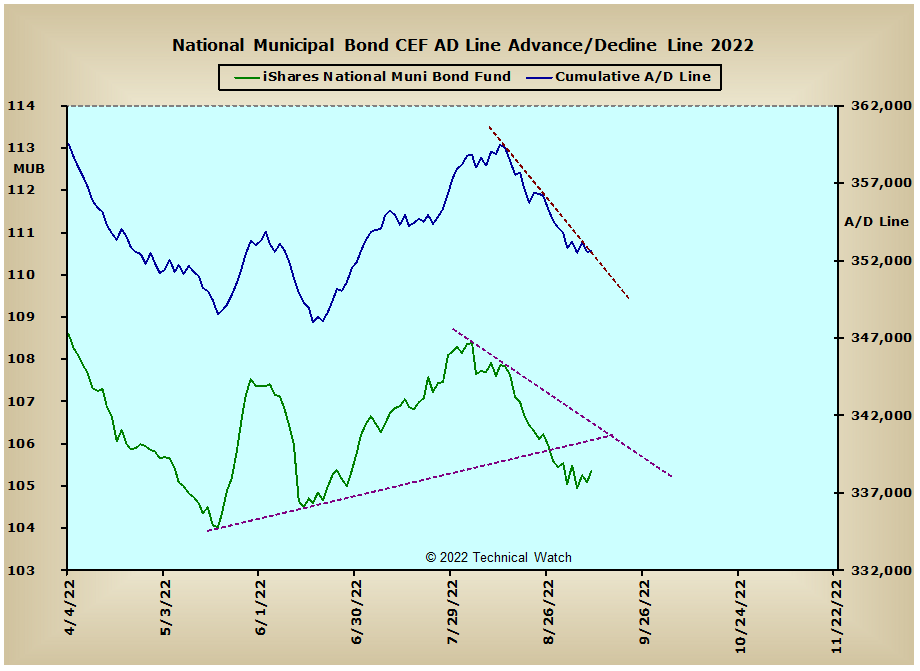
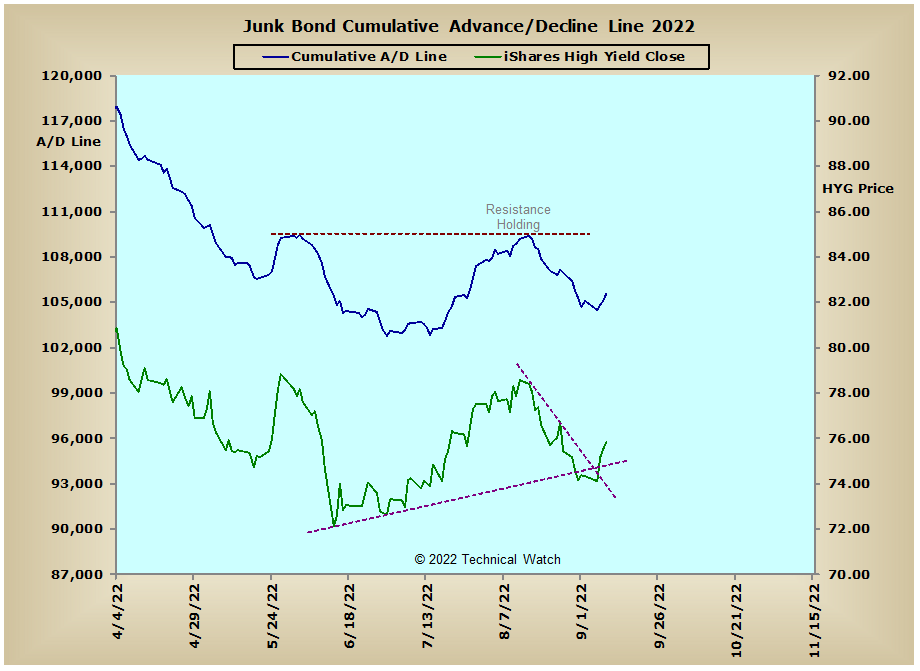
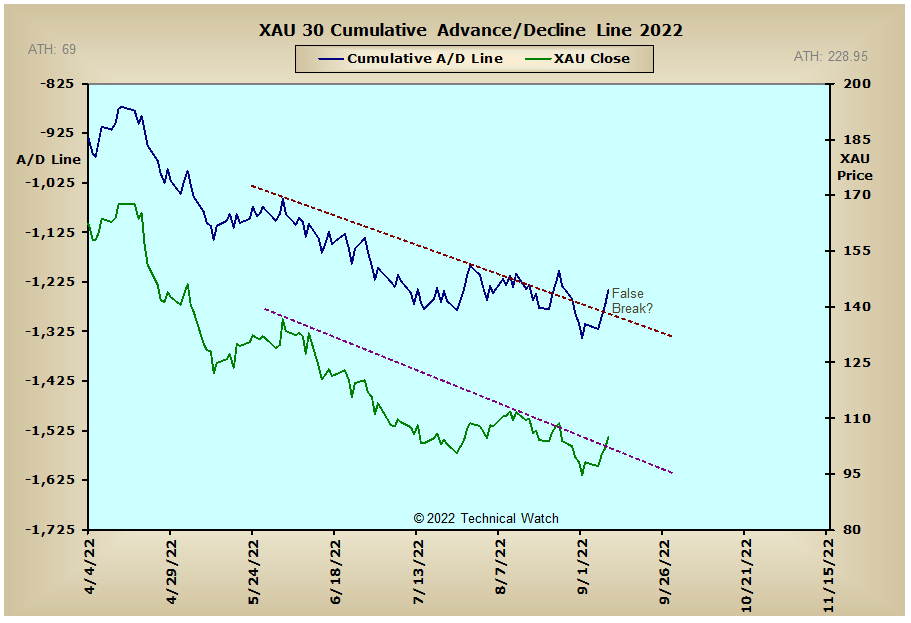
A quick review of our standard array of cumulative breadth charts shows that the NYSE Composite, NYSE Common Only, NYSE Specialty CEF's and Russell "1987" advance/decline lines have now snapped back to or toward their respective short term trendlines of resistance, while interest rate sensitive issues remain under downside pressure. With the FedWatch Tool now suggesting a 90% chance of a 3/4% rate hike by the Federal Reserve on September 21st, this will continue to keep heavy pressure on all things financial as liquidity levels continue to quickly recede. Lower and lower liquidity levels also increase day to day market price volatility, while precious metals will suffer as the expectation of future inflationary pressures continues to subside. On the flip side of things, European issues still show quite a bit of bullish buoyancy at this time, while the Bombay advance/decline line finished off the week in record territory.
So with the BETS moving higher to a reading of -40, traders and investors continue to remain defensive toward equities. Looking at the breadth and volume McClellan Oscillators and we see that all have now snapped back to or toward their zero lines, and this is providing support to the NYSE Composite breadth and volume, OEX breadth, MID breadth & volume McClellan Summation Indexes as they attempt to hold at their respective zero lines. Both the NYSE (.81) and NASDAQ (.82) Open 10 TRIN's finished on Friday on the doorstep of being technically "overbought", while the 10 day average of CBOE and Equity put/call ratios remains relatively flat as we go into this year's 3rd quarter OPEX period later in the week. With message board sentiment moving with lightening speed from bear to bull in less than 4 trading days, along with the internals failing to provide confirmation of such opinions, the potential for next week is for further volatile, choppy behavior as quadruple expiration of options and futures become the prime focus. So with all this as a backdrop then, let's go ahead and continue to walk the path of bearish least resistance for the week ahead, while being mindful that with the continued contraction of investment capital out there to be put to work, sharp market declines can and will pop up with very little warning.
Have a great trading week!
US Equity Markets: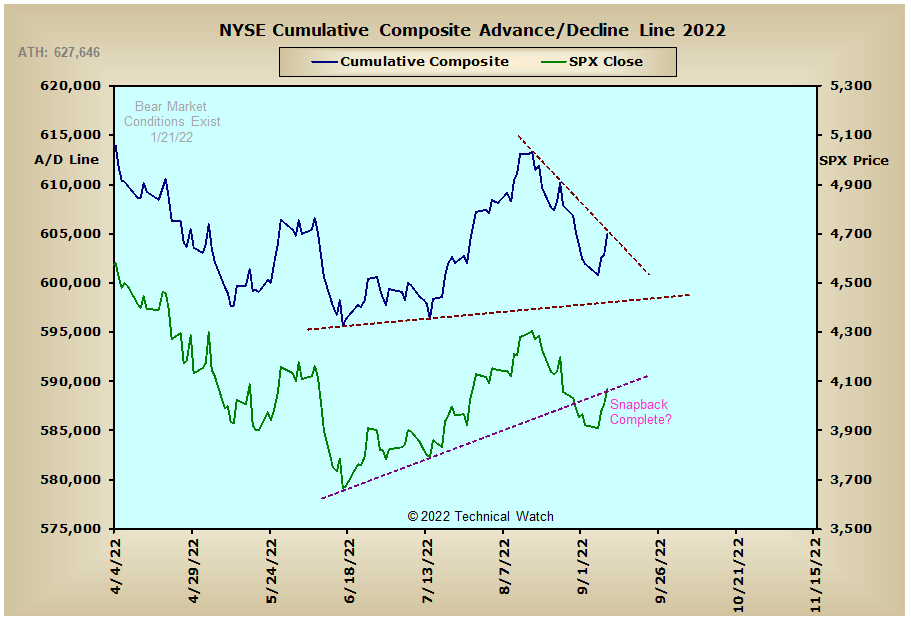

US Interest Rates: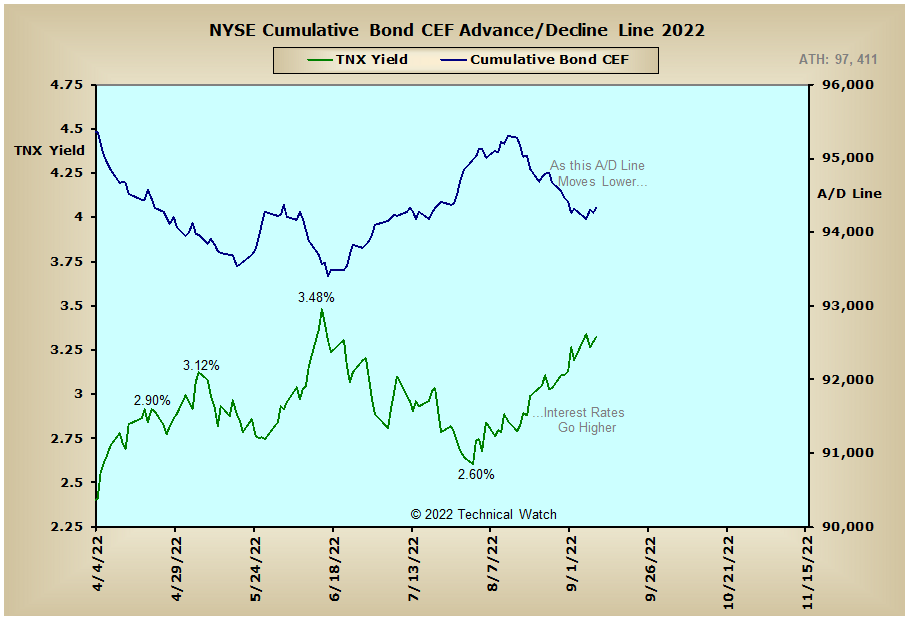
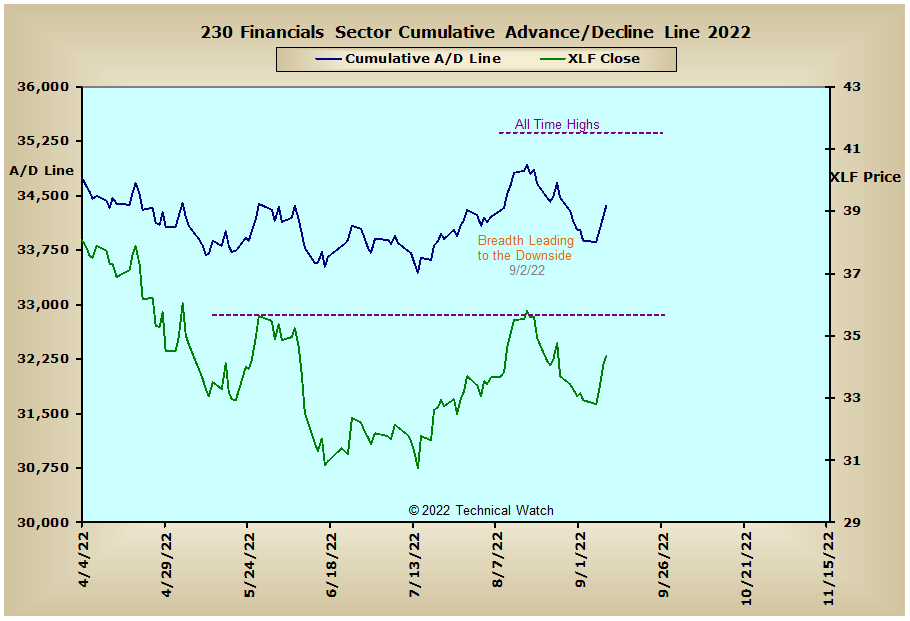
US Sectors: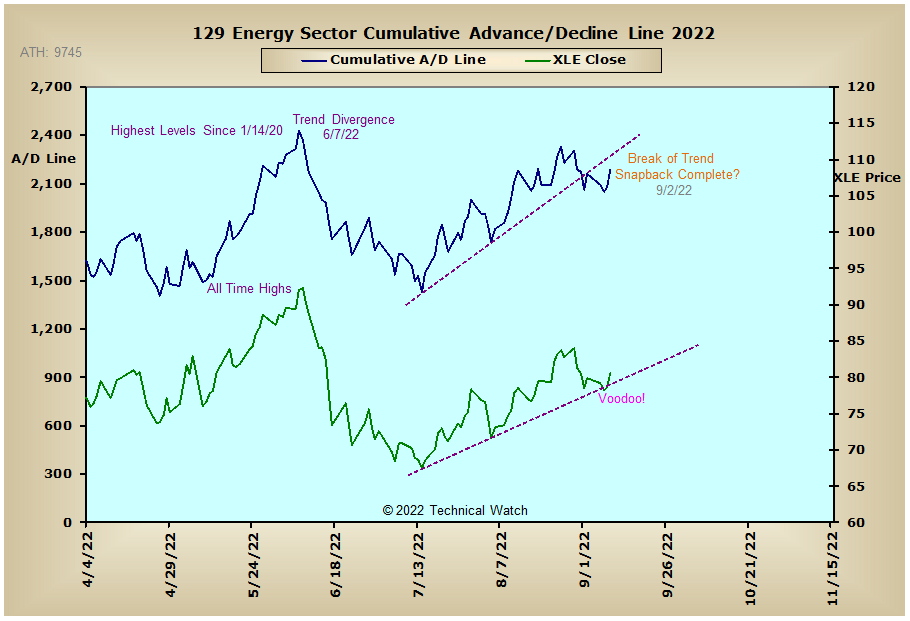

Precious Metals: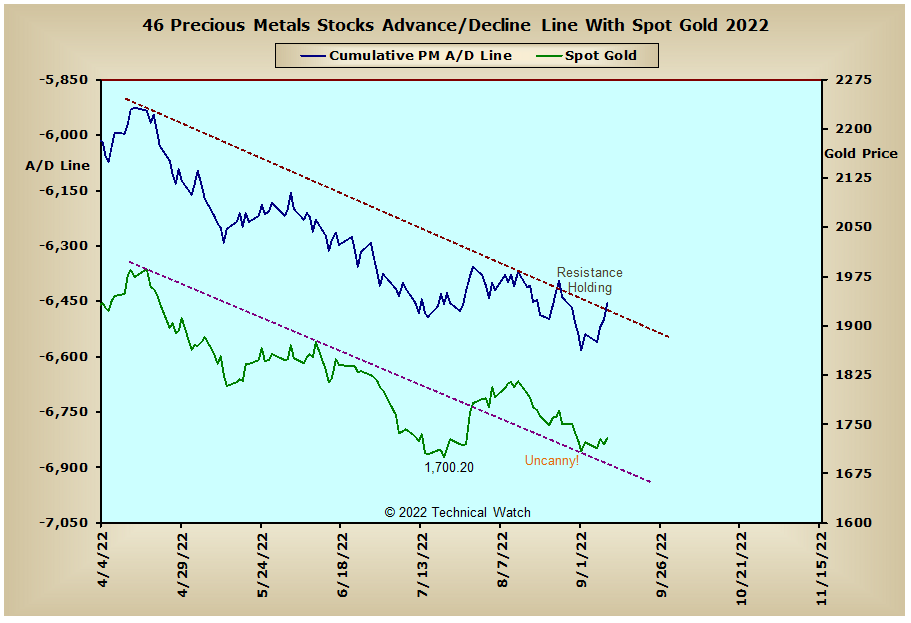
Australia: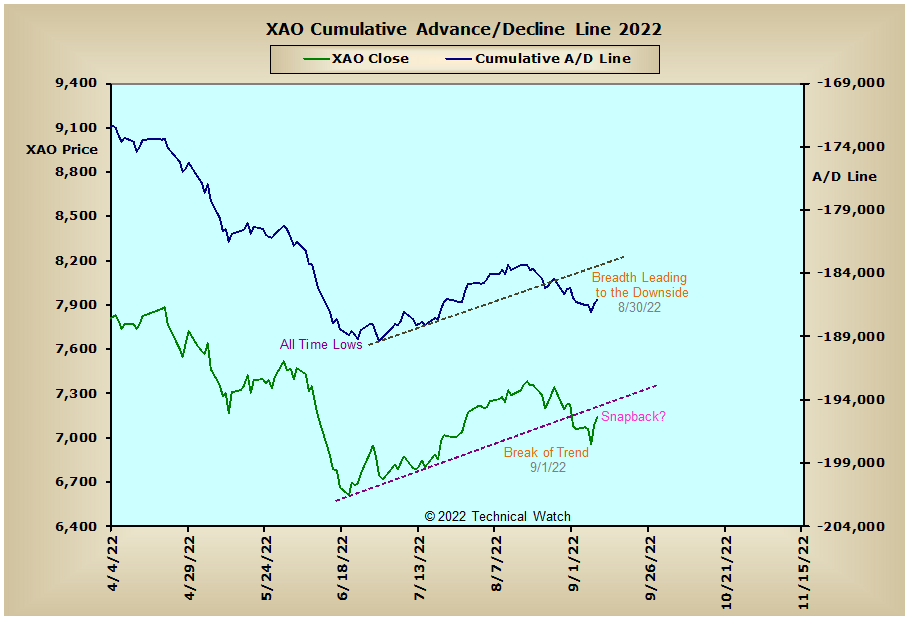
England: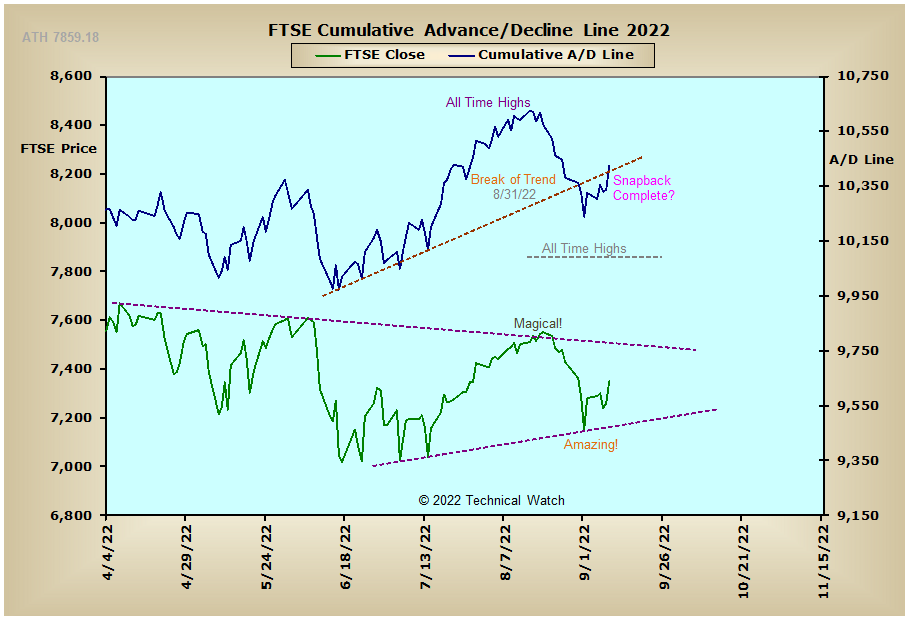
France: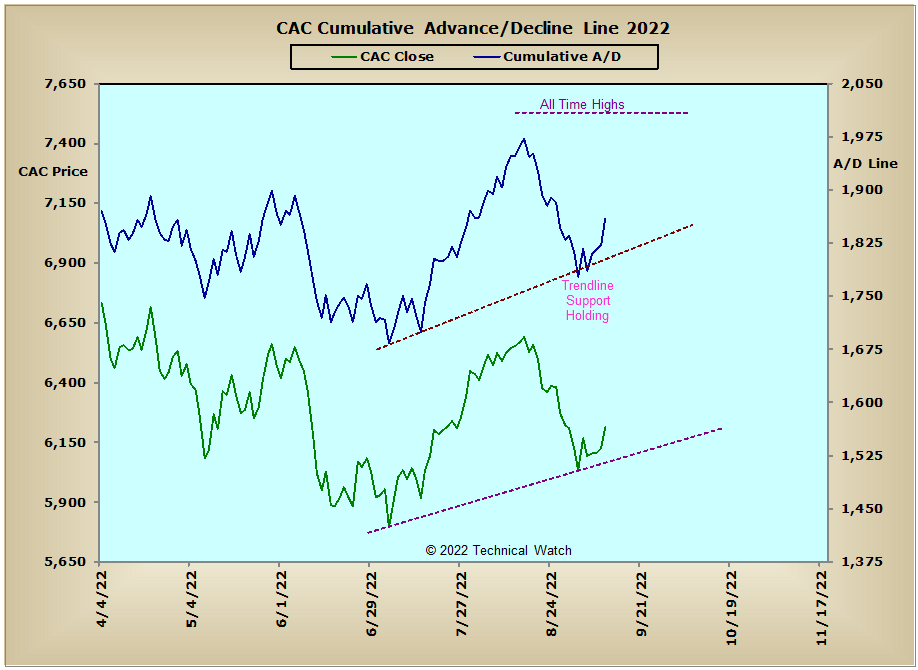
Germany: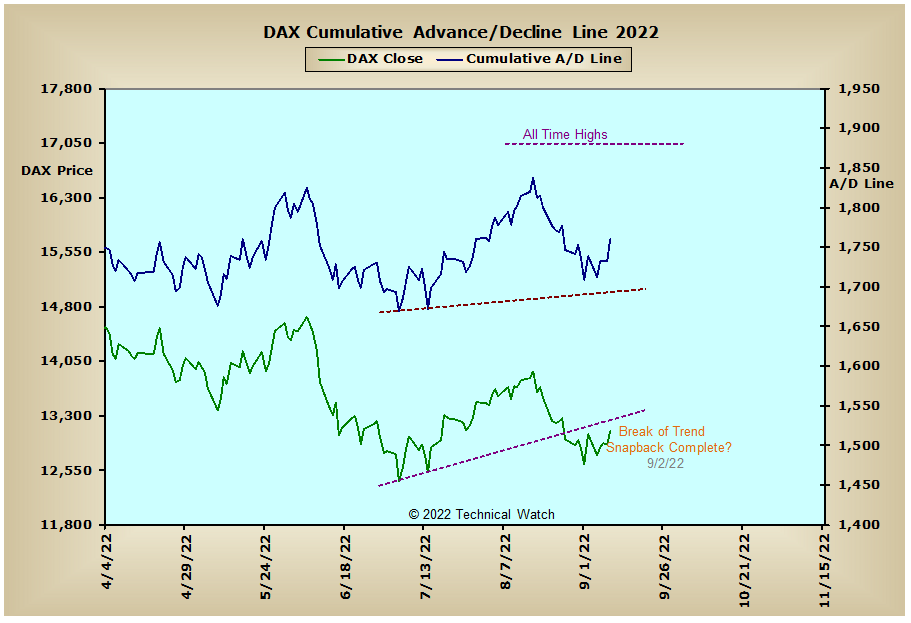
India: