After seeing another attempt on Monday to break free of the current downtrend from mid August, the major market indices moved sharply lower once again by an average of -5.09% for its fifth loss in the last six weeks. Leading the equity markets lower were the Mid Cap (-5.92%) and Small Cap (-5.59%) issues, with nearly every index finishing on Friday below their 200 week EMA's and at or around their lowest levels for the year.
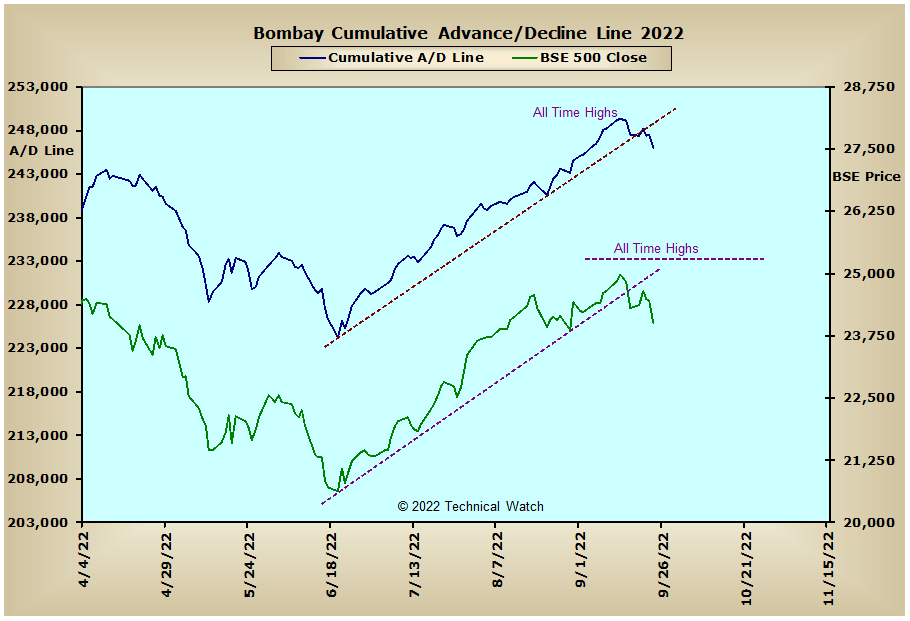
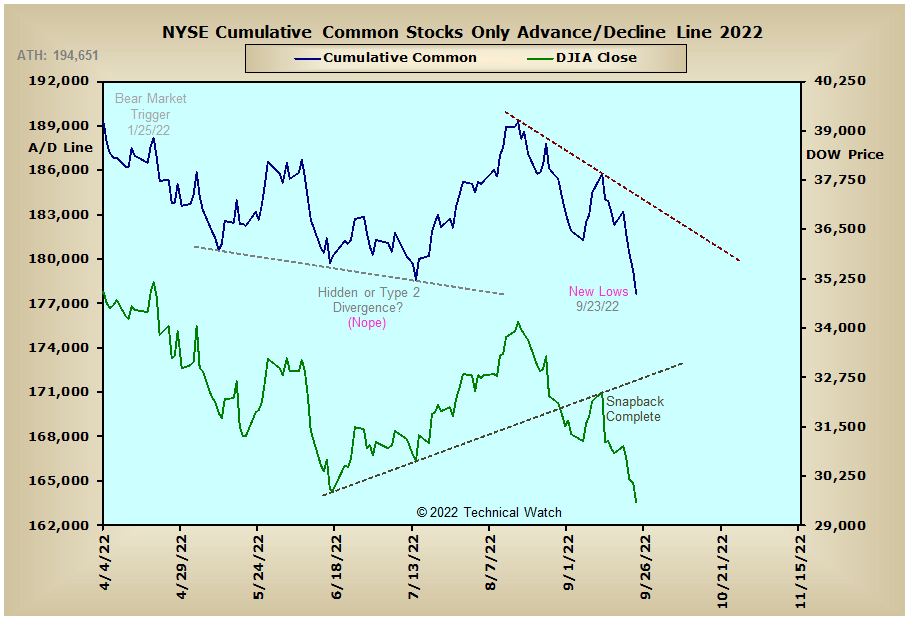
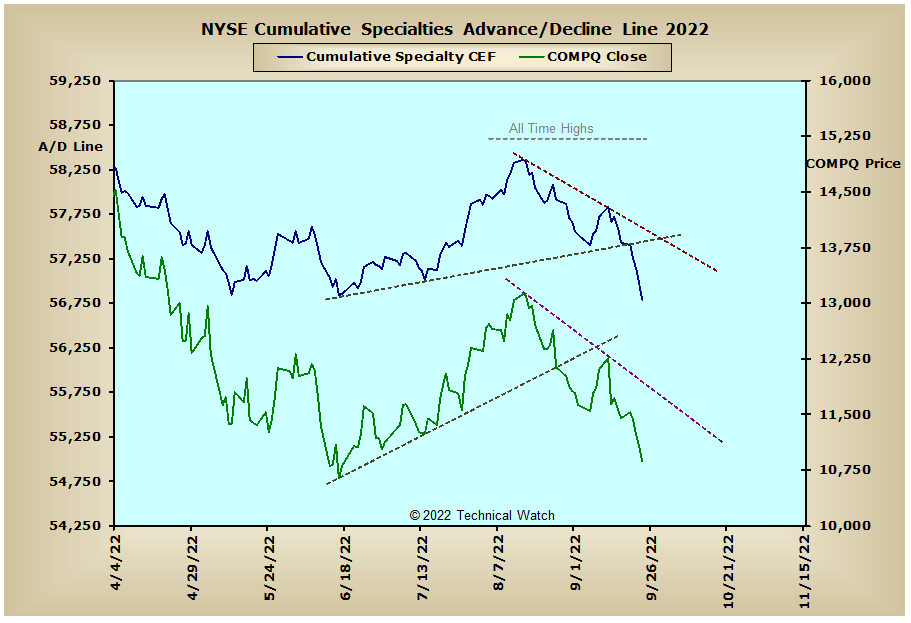
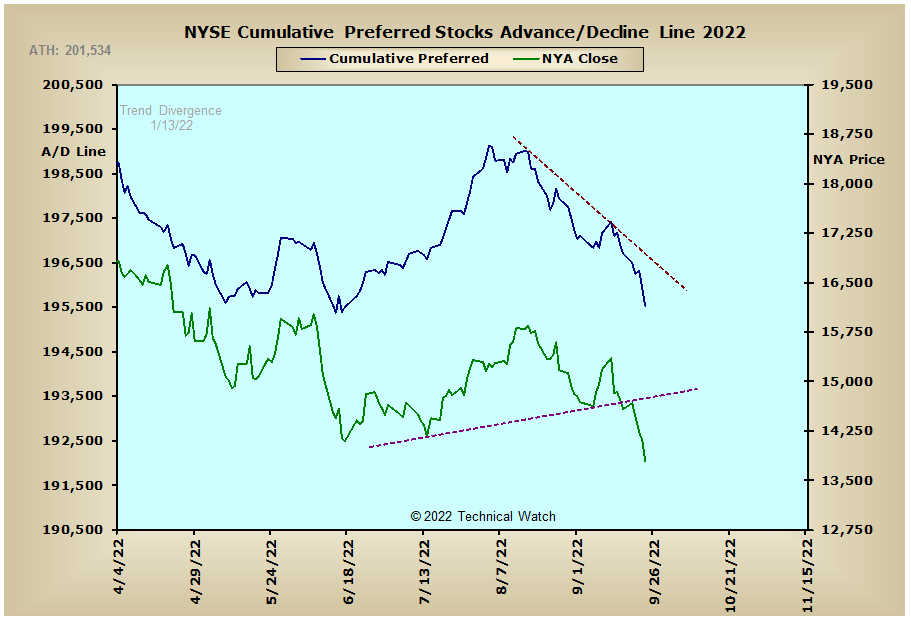
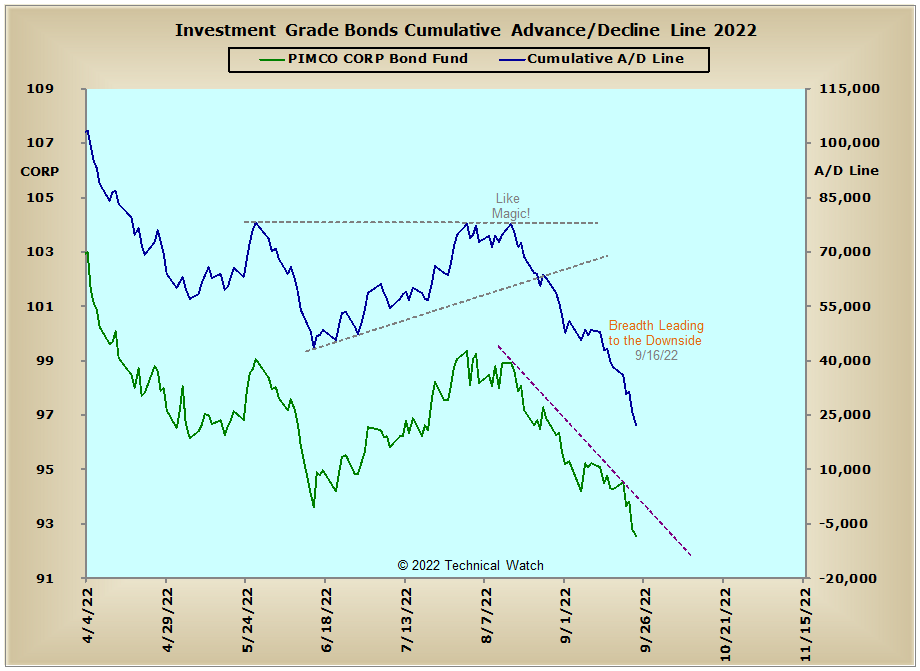
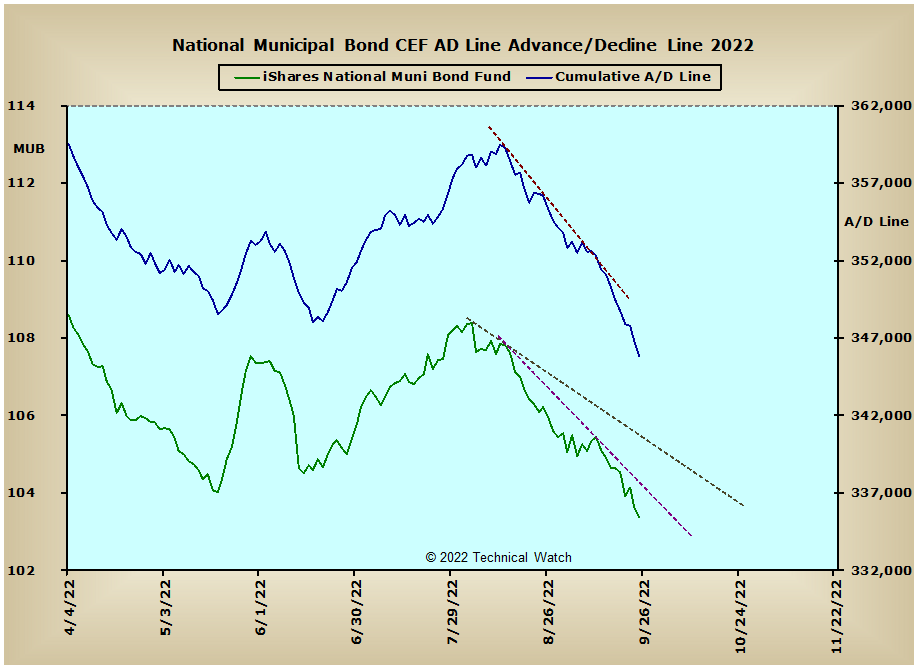
Looking through our usual array of cumulative breadth charts for this week shows that many of the NYSE and interest rate sensitive money flow lines also finished at fresh lows for the year. This includes the NYSE Common Only advance/decline line which maintained throughout the 3rd quarter advance from mid June to mid August that the market was likely providing us with a highly "oversold" bear market rally which ultimately found index chart resistance at or near their respective 200 day EMA's. With yields on T-Bills now higher than that of the 10 year note (and beyond), the yield curve is now inverted by its widest spread since 2008. It should also be noted that inverted yield curves of any degree have a historic consistency in forecasting economic recessions. With Fed policy continuing to have a hawkish view on the current politically created inflationary forces that have been effecting us all, this time will be no different...it's only by what degree and a question of longevity which is still left to be unanswered. Looking internationally, and we see that the Bombay, CAC, DAX and FTSE advance/decline lines all finished below trendline support on Friday, while the Australian advance/decline line settled at new all time lows which is all adding to the dreary outlook ahead.
So with the BETS at its lowest weekly levels since the 2007-2009 bear market at -80, market participants continue to trade in a highly hostile and volatile marketplace. A cursory look at the breadth and volume McClellan Oscillators show that many finished on Friday at their lowest levels of the year. This includes breadth and volume measurements for both of the NYSE Common Only and Composite basket of issues. As mentioned back on our September 2nd review, Elliott Wave 3rd wave crash sequences are always accompanied by the greatest negative amplitude readings for both breadth and volume. With the NYSE Common Only and Composite advance/decline lines settling on Friday at their lowest levels of the year, along with the June and July price lows presently being challenged, the minimal ingredients are now upon us to where an accelerated downside sequence in prices is highly probable over the next several weeks. The current NYSE Open 10 TRIN reading of 1.39 does suggest that a snapback of to or toward any recent horizontal breaches of price support might be attempted near term, but this is countered by the NASDAQ Open 10's more neutral reading of .89 which suggests that further selling is needed before we see a tradable bottom. With the 10 day average of CBOE and equity put/call ratios only now beginning to see speculative put buying rising on Friday, this type of sentiment readings also suggests that we'll need to see more weakness in prices before the fear factor is high enough for more than a one day reversal. With all this in the pot swirling around to work with then, let's continue to walk firmly on the bearish path of least resistance for the week ahead, while at the same time, remaining fully disciplined in our executions as we prepare to go into the infamous month of October.
Have a great trading week!
US Equity Markets: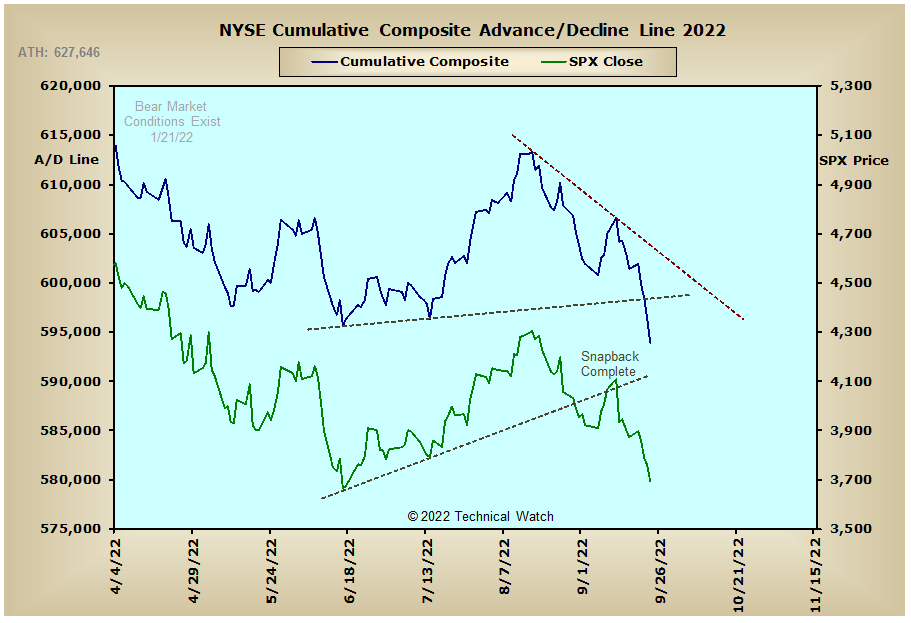

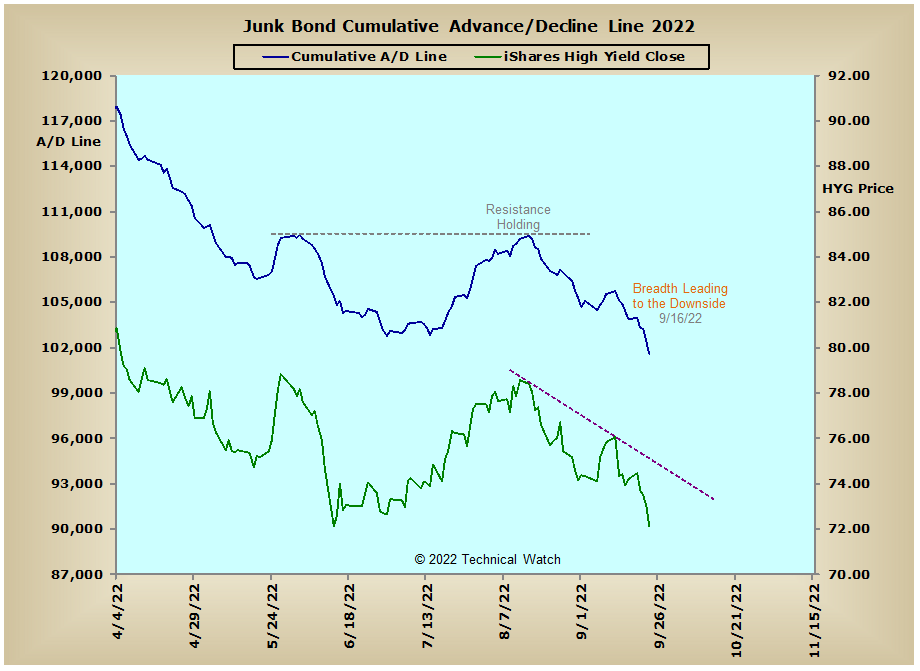
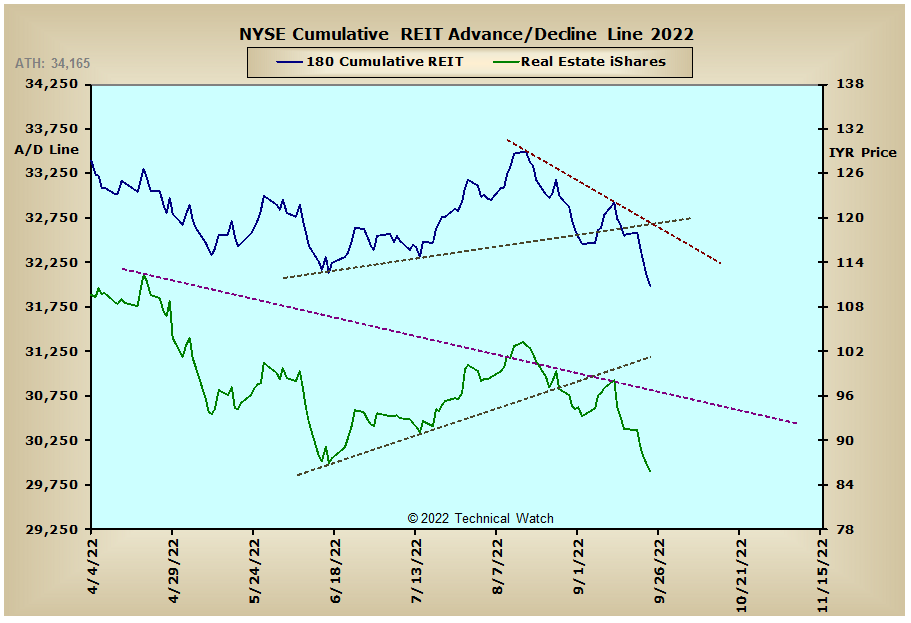
US Interest Rates: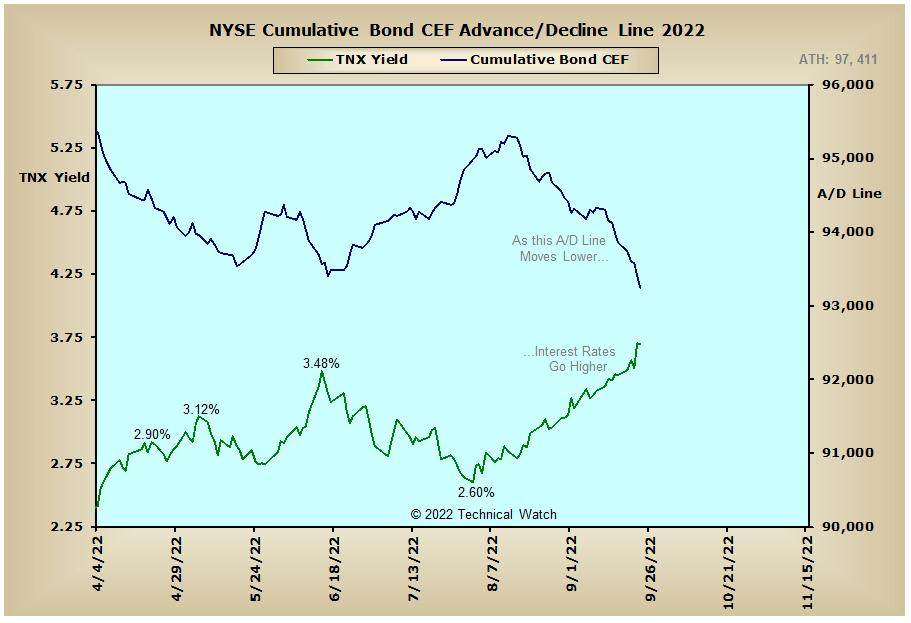
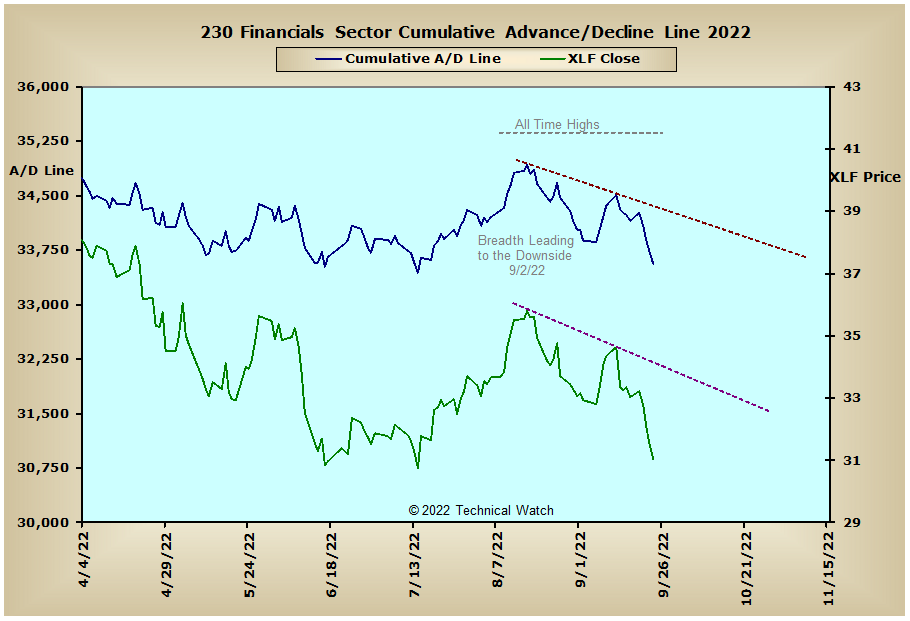
US Sectors: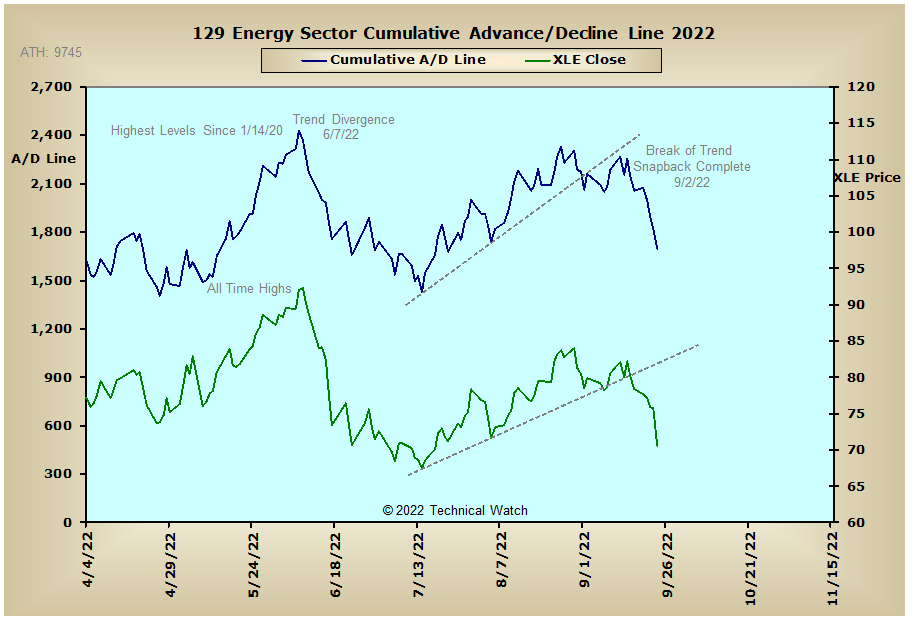
Precious Metals: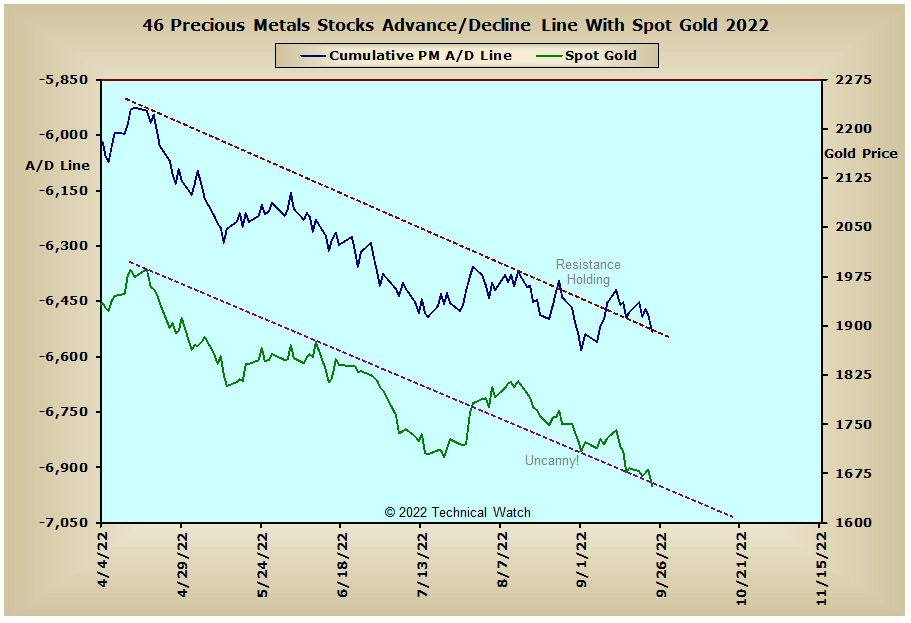

Australia: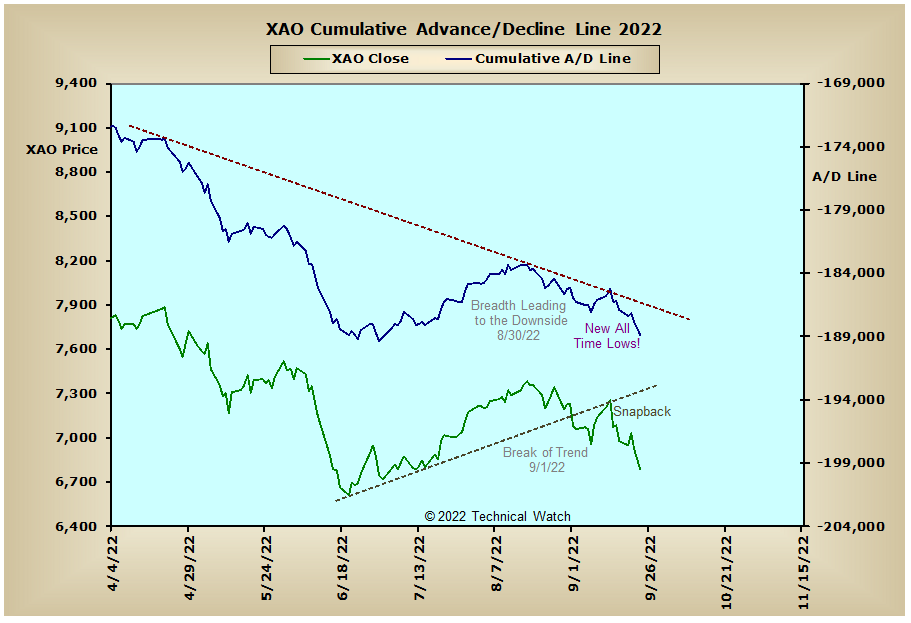
England: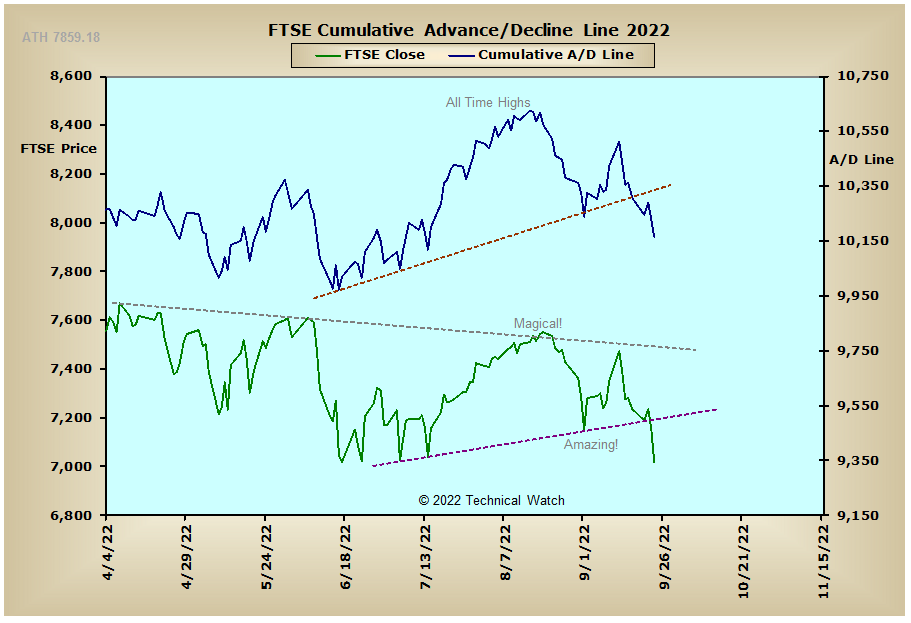
France: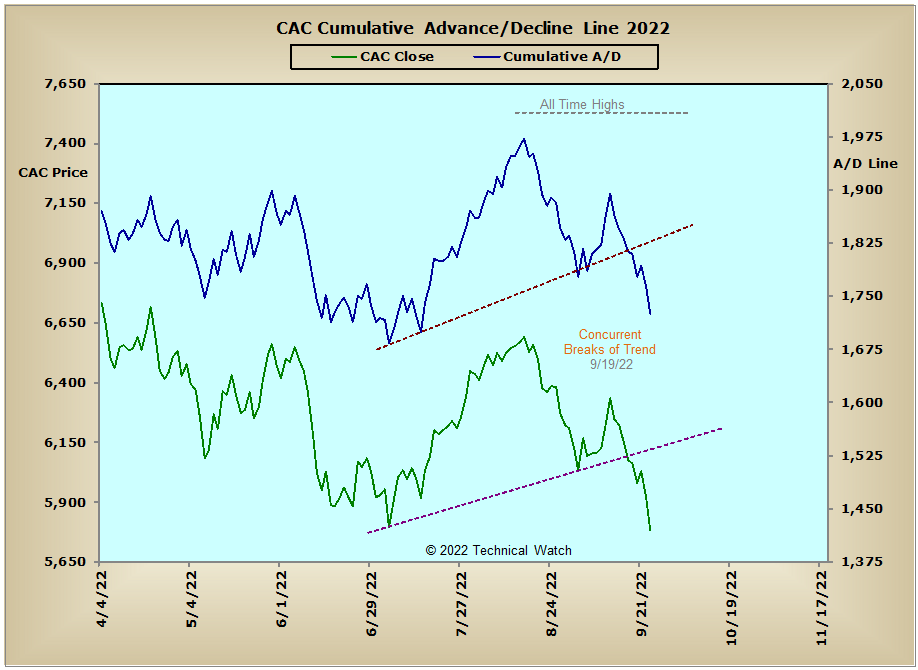
Germany: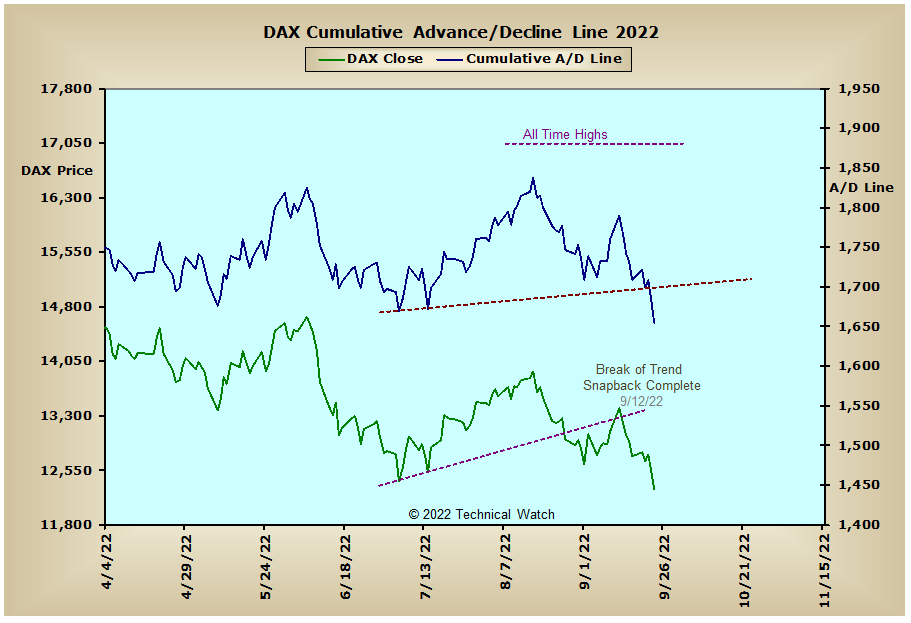
India: