Great question, Doug. Personally, I don't think there is a more important question a trader could ask! Yet, the answer is allusive - which may well account for about 99% of our frustrations in this biz.

I'll lay out my thoughts on this, fwiw. Sorry if they are not as simple as some would like.
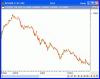
In the chart below, the 4-year cyclical market trend (what we normally refer to as bull market or bear market) is
approximated by the direction of the 55 week MA, and in the next chart, the IT Trend is
approximated by the 55 day MA. Finally, in the third chart, the ST trend is
approximated by the 55 hour MA.
But that's a
huge oversimplification. There is NO easy answer. I would submit that identifying the "trend" in the market is both one of the most difficult, yet one of the single most important determinates of success that we face as market traders. If we get it wrong - we generally lose. Period. And vice-versa.
Of key importantance to me is the "maturation" of a trend. Each has a beginning, a middle, and an end. As Yogi Berra has said "It's not over till it's over", and this seeming nonsensical sentence turns out to have huge implications for traders. My biggest errors occur in proclaiming a trend OVER too soon or too late. Each trend goes thru several phases of its life-as we do, for example. It has been said that a bull market is born in fear, grows in skeptiscism, matures on confidence, and finally dies in euphoria. This is true of each uptrend - no matter what the time frame. Downtrends have thier own maturation characteristics. So in order to know what the current trend is, we must be watching to see if a trend that began at a particular point has or has not gone through the necessary steps to have completed, and if not - just where we are within that progression. Tricky stuff- again, no easy answers.
Following the charts are my "Four Friends" thoughts on how we know where we are in the cycle at any given time, last updated in October, 2004. Imperfect as it is, I think it addresses the "trend" question.
http://stockcharts.com/def/servlet/SharpChartv05.ServletDriver?chart=$SPX,uu[g,a]whclyyay[d19990323,20051223][pb55][vc60][iuah12,26,9!ld20!lo14!lh14,3][J32449460,Y].gif
http://stockcharts.com/def/servlet/SharpChartv05.ServletDriver?chart=qqqq,uu[r,a]dhclyyay[dc][pb55][vc60][iuah12,26,9!ld20!lo14!lh14,3][j21152059,y]&r=5749.gif
http://stockcharts.com/def/servlet/SharpChartv05.ServletDriver?chart=QQQQ,uu[g,a]ehclyyay[d40][pb55][vc60][iuah12,26,9!ld20!lo14!lh14,3][J19218173,Y].gif
Four Faithful Friends October 2, 2004
Monetary trend
Cyclical trend
Sentiment
Momentum
Originally posted in May, 2003. Here is another update, as this cyclical bull enters its end stages, highly likely, in the opinion of this author, to be marked by a magnificent final rally into 2005. The following is a very long winded explanation of why I say "the trend is up". Ideas and opinions expressed here are those of this writer only, and do not represent recommendations to buy or sell any security. Caveat Emptor.
_____________________________________________________
I. Monetary trend: The plain fact is this: when monetary policy is in an expansionary phase, cyclical bull markets ultimately follow. Likewise, when monetary policy is in a contraction phase, bear markets eventually follow. But there is virtually always a lag time. New bull or bear markets begin 6-18 months after the Fed policy reverses policy- as the cyclical bull market did from the October 2002 bottom, after more than a year and a half of Fed easing. Subsequently, rates continued downward, bottomed, and held at low levels - but then the Fed began to raise rates several months ago, after a three-year period of accommodation. The Fed cycle has reversed, and the window for a cyclical bull market peak is now upon us. Sentiment and momentum measures need to be monitored for signs of the cyclical bull market peak. But, meanwhile:
We are currently in a cyclical bull market.
_________________________________________________________
II. Cycles: Tim Wood in a May 9, 2003 article posted here, said it best: Going back to 1896 the 4-year cycle has averaged 47.08 months in duration. The last confirmed 4-year cycle bottomed in September 1998 at 7,400.30 on the Dow. The next 4-year cycle low was ideally due in the fall of 2002. {it did so in October 2002} The plain fact is that the cyclical market has bottomed in the second year of the election cycle for decades, almost as faithfully as the moon comes up full every 28 days. 2002 was no exception, nor will be 2006. In a similar fashion, bull cycles peak right around, or shortly after, the presidential election, as it did in late 2000, for example. Look for the peak around Jan 2005, plus or minus a couple of months.
If you subscribe to Decision Point, you can see the 4-year cycle chart here:
Four Year Cycle
And following is a chart of the SPX since 1999. The Primary Trend can be seen a defined by the 55 week MA, and recent IT trends are labeled, up fron Mar '03 to Jan '04, then down into August '04, then having turned back up once again:
http://stockcharts.com/def/servlet/SharpChartv05.ServletDriver?chart=$SPX,uu[g,a]whclyyay[d19990323,20041223][pb55][vc60][iuah12,26,9!ld20!lo14!lh14,3][J32449460,Y].gif
But, meantime:
We are currently in a cyclical Bull Market.
____________________________________________________________
III. Sentiment: Earlier incarnations of this Four Friends post have detailed the EXTREME bearish sentiment in the fall of 2002, then again in Feb, March 2003, and the opposite extreme bullish sentiment - at the first Intermediate Term peak of this four year cycle in December 2003/January 2004. The latter extremes set up the IT decline which followed throughout Jan-March 2004, to be followed by a protracted base which formed over March-Aug 2004.
By now weve come full circle. In May 2004, Sentiment readings were amazingly bullish once again. Ten-day Open ARMS readings, for example, at 1.48 in March, the internal low of this IT base, reached their best readings since September 2001 (following 9-11)! Now THATS extreme!
ARMS INDEX
Meanwhile, at 1.08, the CBOE Call/Put Ratio 10 DMA in May EXCEEDED its September 2001 reading, or any other reading this decade. Now, again, THATS extreme! And it remains (late in June) at levels associated with bottom areas, with CBOE 10-DMA Put/Call Ratio in the 90s and the Equity P/C Ratio in the high 70s:
Put/Call Ratio
In short:
Sentiment has reached multi-year record extremes, fully supportive of the next IT advance. We have a long, long way to go before these readings get to levels even approaching IT top levels. Meanwhile:
The market is in the very early stages of an Intermediate Term Advance.
________________________________________________________________
IV. Momentum: Momentum, as shown by the seven sentinels linked below:
Sentinels
as well as by MCO indicators for each of the various indices, by advance/decline cumulative data and A/D volume cumulative data as reported here and here (Fibs board):
Cummulative Data
..reached bottom extremes in March/May/August, and turned up. Notice that cumulative A/D lines, A/D Volume, and the rest, are now up and away from their consolidation areas, indicating that the new IT uptrend is underway. Notice, too, that as all of the major stock indices moved to new yearly lows in May, most major measures of market internal momentum held above their March 2004 lows in May, then likewise in August, held above the May levels A clear indication that the IT had bottomed by August 2004. Here is an excellent example of that as the SPX made lower lows in Mar, May, August
the SPX MCO made a series of rising bottoms, each subsequent one higher than the previous low.
McClellan Oscillator
The Summation Index for EACH major stock index or group is in positive territory, and rising, indicative of a new Intermediate Term uptrend. This is occurring, of course, within the context of a cyclical bull market. The trend is your friend, and the trend is UP.
These and ALL other momentum measures that I follow are consistant in their message, which is:
The market is in the very early stages of an Intermediate Term Advance.
__________________________________________________________________
Overall Conclusion: We are in the last 30% of this Cyclical Bull Market, but just beginning a new IT run.
--------------------------------------------------------------------------------------------
As always, caveat emptor, and please dont forget to place a stop with every entry order.
<{POST_SNAPBACK}>


 I look for the sawtooth. If the drops are quicker than the rises, I call it a downward trend. If the market rises faster than it falls, I call the trend up.
uh
I look for the sawtooth. If the drops are quicker than the rises, I call it a downward trend. If the market rises faster than it falls, I call the trend up.
uh


![http://stockcharts.com/def/servlet/SharpChartv05.ServletDriver?chart=$SPX,uu[g,a]whclyyay[d19990323,20051223][pb55][vc60][iuah12,26,9!ld20!lo14!lh14,3][J32449460,Y].gif](http://stockcharts.com/def/servlet/SharpChartv05.ServletDriver?chart=$SPX,uu[g,a%5Dwhclyyay[d19990323,20051223%5D[pb55%5D[vc60%5D[iuah12,26,9!ld20!lo14!lh14,3%5D[J32449460,Y%5D.gif)
![http://stockcharts.com/def/servlet/SharpChartv05.ServletDriver?chart=qqqq,uu[r,a]dhclyyay[dc][pb55][vc60][iuah12,26,9!ld20!lo14!lh14,3][j21152059,y]&r=5749.gif](http://stockcharts.com/def/servlet/SharpChartv05.ServletDriver?chart=qqqq,uu[r,a%5Ddhclyyay[dc%5D[pb55%5D[vc60%5D[iuah12,26,9!ld20!lo14!lh14,3%5D[j21152059,y%5D&r=5749.gif)
![http://stockcharts.com/def/servlet/SharpChartv05.ServletDriver?chart=QQQQ,uu[g,a]ehclyyay[d40][pb55][vc60][iuah12,26,9!ld20!lo14!lh14,3][J19218173,Y].gif](http://stockcharts.com/def/servlet/SharpChartv05.ServletDriver?chart=QQQQ,uu[g,a%5Dehclyyay[d40%5D[pb55%5D[vc60%5D[iuah12,26,9!ld20!lo14!lh14,3%5D[J19218173,Y%5D.gif)
![http://stockcharts.com/def/servlet/SharpChartv05.ServletDriver?chart=$SPX,uu[g,a]whclyyay[d19990323,20041223][pb55][vc60][iuah12,26,9!ld20!lo14!lh14,3][J32449460,Y].gif](http://stockcharts.com/def/servlet/SharpChartv05.ServletDriver?chart=$SPX,uu[g,a%5Dwhclyyay[d19990323,20041223%5D[pb55%5D[vc60%5D[iuah12,26,9!ld20!lo14!lh14,3%5D[J32449460,Y%5D.gif)