https://seekingalpha...87759ea112&dr=1

Member
Posted 05 July 2017 - 02:53 PM
Member

Posted 07 July 2017 - 05:29 PM
Well, is he still bullish?
Would like to read his next posting!
gis
P.S. Was expecting the 1218 to 1220 area to hold, but it didn't.
However, next week is the bottom in my weekly cycles so we might be near a bottom now.
Member
Posted 07 July 2017 - 11:56 PM
I have not seen another post from him Gis, I am seeing a possible low forming here on the gld chart which has a bull flag formation on it too. I am still seeing trends for a high in august and those trends also show up on the Dust chart for a low. The thing that bothers me is the double top on the charts and the breach of the gdx trendline from 1.5 years ago though.
Member
Posted 08 July 2017 - 06:57 AM
I have not seen another post from him Gis, I am seeing a possible low forming here on the gld chart which has a bull flag formation on it too. I am still seeing trends for a high in august and those trends also show up on the Dust chart for a low. The thing that bothers me is the double top on the charts and the breach of the gdx trendline from 1.5 years ago though.
Thanks Russ.
There are many things pointing to this being a low for a few weeks, but only time will tell.
gis
Member
Posted 08 July 2017 - 08:12 AM
I have not seen another post from him Gis, I am seeing a possible low forming here on the gld chart which has a bull flag formation on it too. I am still seeing trends for a high in august and those trends also show up on the Dust chart for a low. The thing that bothers me is the double top on the charts and the breach of the gdx trendline from 1.5 years ago though.
Thanks Russ.
There are many things pointing to this being a low for a few weeks, but only time will tell.
gis
The other thing I noticed is that XAU has not broken its support line and it looks possible that it will head back up to the top of its wedge now, but it could also break that support line next week. Here is the update.... 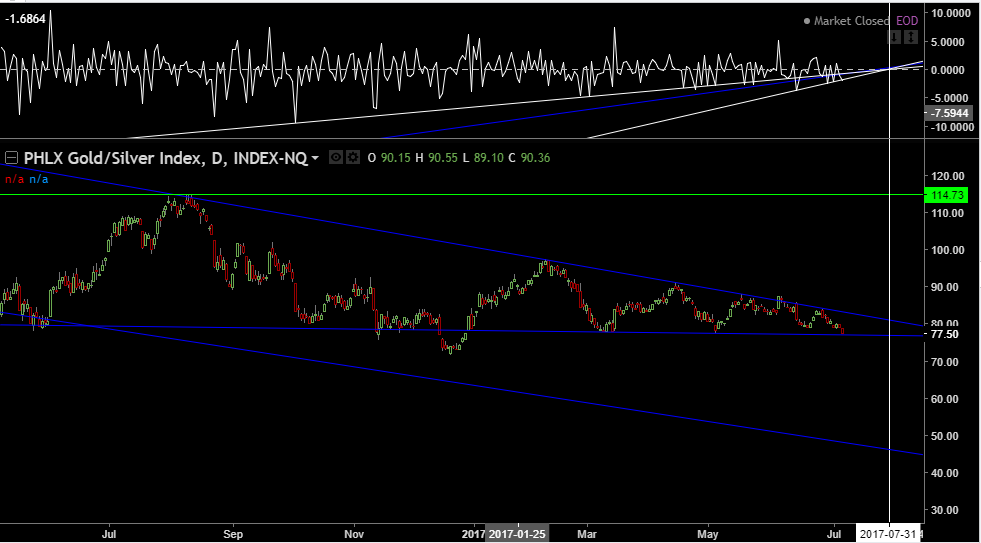
Edited by Russ, 08 July 2017 - 08:14 AM.


