Wall St. Sentiment Weekly 8/20/17
Institutional Sentiment Research
Published Sunday 8/20/2017
By Mark Steward Young
Short-Term Sentiment: Mixed (subject to review).
Overall Intermediate-Term Sentiment: Neutral for the market.
Individual Investor Sentiment: ST Bullish for the market. IT Neutral for the market.
Small Speculator Sentiment: ST Bullish for the market, and IT Neutral-to-Bearish for the Market.
Small Hedge Fund/Manager Sentiment: ST Bearish for the market and IT Bearish for the Market.
Longer-term Trend:
Bull Market Condition.
Intermediate-term Trend:
Negative. Confirmed.
Secret Hedge Fund:
Repeat Buy.
Short-term (one or two-day) Signal:
Sell and a Buy.
We are trading these signals and others intra-day for our Premium subscribers--contact us for details ( call the number below or reply to this email).
********************************************************
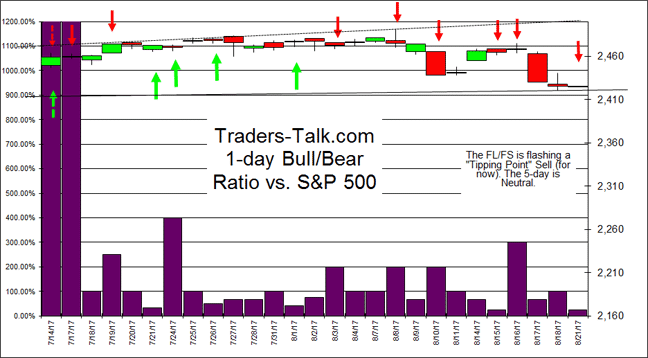
The Fully Long/Fully Short is flashing a "Tipping Point" Sell. The Options Oscillator is still on a Buy. The P/C's are Bullish. The "Secret Hedge Fund" Indicator is flashing a repeat Buy.
********************************************************
Late Evening Indicators
Best Trend: Negative. Confirmed.
CBOE:SPX: Buy. Unconfirmed.
ST Momentum: Negative. Confirmed.
Swing Momentum: Negative. Confirmed.
IT Momentum: Negative. Confirmed.
Breadth: Bearish.
Results of the Wall Street Sentiment Survey (formerly known as the Fearless Forecaster Sentiment) taken after the close on 8/18/17:
Response was to this question: "At the end of next week will the S & P 500 close up (bull), down (bear), or unchanged/no opinion (neutral)?"
Weekly BULLS: 40%
Weekly BEARS: 47%
Our `Smart Money' Pollees were 25% Bullish and 50% Bearish.
Our Amateur Trader Pollees were 0% Bullish and 100% Bearish.
Weekly Trading Model:
50% SPY @ 245.59
50% Money Market
This week, Sentiment is again Bullish, and the Trend is unconfirmed Bearish. We will buy the SPY with the remainder of our cash at the open Monday. We are only 1/2 Long for the last Buy signal.
This model will start with the weekly sentiment, and then filter for Bull or Bear Market, and Intermediate-term Trend.
Proprietary Surveys
This week, the WSS Surveyees are almost dead even on poor participation (vacation time). The "Smart Money" Traders are a bit Bearish, and the "Amateurs" are 100% Bearish. I think this sentiment setup allows for some near immediate weakness, and then a rally. Note that these surveys are of a virtually static pool of participants. The same traders and/or types of traders have been participating for over 20 years now with few additions or subtractions.
Chart courtesy StockCharts.com (It will likely update within few hours after publication)
http://scharts.co/Tzi0BP
Message Board Sentiment:
Message Board Opinion - Neutral.
Bulls 18%
Bears 36%
Actual Position Poll - ST Bearish, IT Neutral.
10% Fully Long
20%Partially Long
0% Partially Short
40% Fully Short.
Fully Long/Fully Short: "Tipping Point" Sell.

The Fully Long/Fully Short is flashing a "Tipping Point" Sell on lower participation (we are publishing a bit early--more votes will come in by tomorrow morning). The readings are not consistent with a low, but that is fairly likely to change. The Opinion Poll is Neutral. The 5-day FL/FS is Neutral.
If you'd like to check out these poll results real time, the polls are pinned at the top of this page: http://www.traders-t...ss-forecasters/ .
Options and ETF Sentiment--
Daily CBOE P/C ratio: 1.11. Buy.
10-day P/C ratio: 0.98. Neutral.
Equity P/C ratio: 0.82. Buy.
10-day P/C ratio: 0.76. Buy. Highest level we've seen in long time.
OEX PC ratio (not a fade): 1.92. Neutral.
OEX 10-day PC ratio: 1.56. Neutral.
ISEE Sentiment Index: 73. Bullish.
10-Day ISEE Sentiment Index: 79. Bullish.
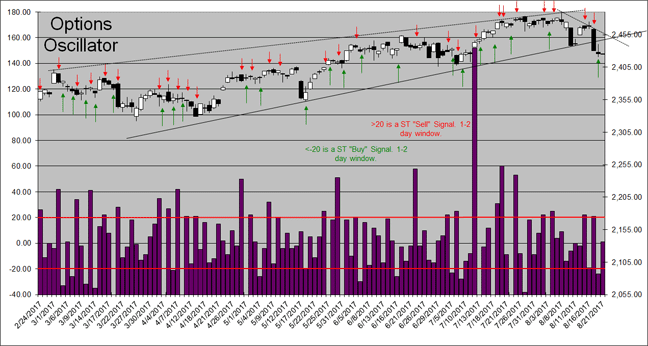
Options Oscillator: +1. Still on a Buy.
Relative VIX: Neutral.
ST VIX: Neutral.
IT VIX: Bullish.
VIX P/C: Neutral.
CBOE:SPX: Positive. Unconfirmed.
OBSG: Buy.
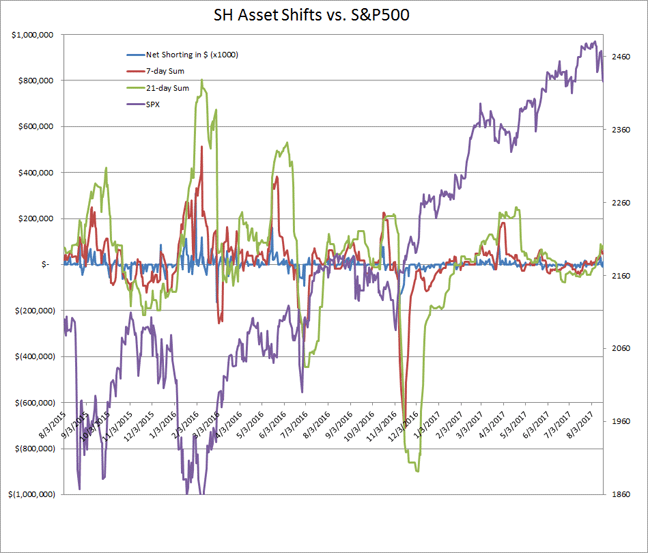
SH Money Flow: The SH reported $12.5MM in net new shorts Friday.
The options are looking fairly Bullish with Buys from the CBOE, and both Equity P/C's, the OBSG, and the Options Oscillator. The Equity 10-day P/C is higher than it has been since June of last year. The Market Harmonics' Options Buyers Sentiment Gauge (thank you, Tony Carrion http://www.market-harmonics.com) is flashing a Buy.

(If the chart is corrupted, use this link: http://www.market-ha...nt/obsglong.gif )
Most options indicators are contrary; if most folks are buying calls, we want to fade them and go short and vice versa. The OEX nominal P/C is an exception, because the OEX traders tend to be right, unless they are paying up for options (which will show up in the $-weighted data). The ISEE Sentiment Index indicator is contrarian; traditionally, over 200 is too optimistic, under 100 is too pessimistic. OBSG provided by Tony Carrion of Market Harmonics.
General Public Polls
Investors.com reports a 2-day shift from 60% Bears to 0% Bears, which is VST Bearish, ST Bearish, and the 3-day is ST Neutral at 50% Bears. Overall this is Mixed. NOTE: this indicator is in development. We make no claims as to its utility at this point.
Investors Intel is showing 50.5% Bulls and 18.1% Bears. That's less Bulls and more Bears but still pretty Bearish for the market. Readings like this need not mark a top. Last week the reported 57.5% Bulls and 17.0% Bears.
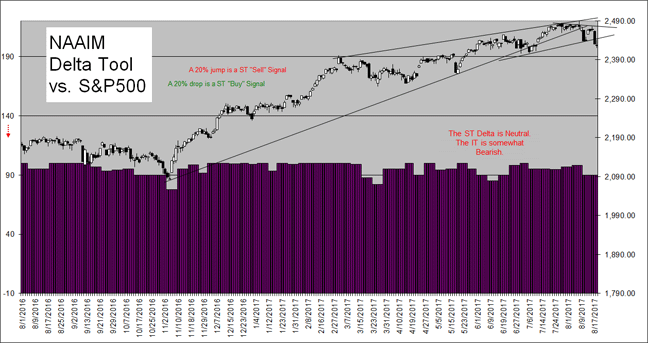
National Association of Active Investment Managers (NAAIM) Sentiment Survey reported that the Median market exposure remained at 90.0% Long. This is ST Neutral. Mean exposure rose 88.92% Long from 83.95% Long. The minimum exposure remained at 0% Short, and Maximum exposure fell from 200% Long to 180% Long. Basically, advisors mostly held the line. Intermediate-term, these readings are troublesome for the market. It has been over a year since our last signal!

AAII is showing 34.20% Bulls and 32.80% Bears vs. 33.70% Bulls and 32.30% Bears last week. A few more Bears. This is still Neutral for the market.
TSP Talk reported 41% Bulls and 39% Bears this week. This is Bullish. They had 37% Bulls and 44% Bears last week.
Citigroup Panic/Euphoria Model is Neutral.

http://online.barron...etSentiment.gif
Systemic Risk: The Financial vs. non-Financial Commercial Paper differential fell to 0.05, which is benign. I believe that this will give us a heads up if there is a systemic shock of significance building in the financial system.
Conclusion
Last time, I said that the decline went a long way toward working off the overbought condition. Momentum wasn't that far from Buy territory and the "Secret Hedge Fund" Model was flashing a Buy. We warned that everything was Bearish trend- and breadth-wise, and the chart was saying that we'd probably just completed the first leg down, so we had to be careful being Bullish, but we also knew that this market can rally fast and hard, and we also knew that the "Secret Hedge Fund" Indicator doesn't make us wait long to get a rally when it issues a Buy. I expected that we would rally smartly either immediately or quite soon and then test perhaps later in the week, or next. We indeed rallied smartly almost immediately and then tested and modestly exceeded the lows Thursday and Friday. We've now have the minimum requirements for a completed correction. We also have a repeat "Secret Hedge Fund" Buy. Of course, everything else, except the CBOE:SPX and the options are Bearish. What this means is that we may have more correction to go--it happens occasionally with the "SHF" Buy, and such would set the oscillators up better. What we know is that if we're not in a Bear market, if the signal is early, we won't suffer too much, nor too long. There's so much Bearishness, I think that the low is near. The FL/FS data isn't consistent with a low, and in fact it's flashing a "Tipping Point" Sell, but that could easily change to a Buy by Monday. If it does, I'll send out a little update. I'm adding here and there. I'll also likely take off the Breadth Model short if not Monday, then Tuesday.
Intermediate-term, Cumulative Breadth turned back down and Cumulative A/D Volume remains on a confirmed Sell. Our "Best Trend" is on a confirmed Sell. The ITBM is on a confirmed a Sell. Short-term and Swing Momentum are positive, and IT Momentum turned back down and confirmed. Our Breadth model is on a confirmed Sell. Our "Secret Hedge Fund" Indicator is flashing a repeat BUY. The VIX is ST Neutral and is IT Bullish.
Secret Hedge Fund Model
25% SSO at 83.29
25% SSO at 84.60
50% Cash
The Secret Hedge Fund Model indicator is flashing a repeat Buy. We may add, but not just yet. We bought another 25% position in the SSO at 84.60. We already have a 25% position in the SSO from 83.29. As a practical matter, we are going to use 2x ETF's (SSO and SDS) both for possible leverage, but more importantly, for tax efficiency. We will, in fact, hedge during down trends if warranted.
Breadth Model
The ITBM is on a confirmed Sell. We bought a 25% position in the SDS at 12.46. We may take this position off shortly.
75% Cash
25% SDS at 12.46
A word on our Breadth Model: This trading model is based upon breadth momentum and has a seasonal and sentiment overlay to trim risk a bit. Signals are designed to capture much more of the "swing moves". We've watched these indicators for 20 years and we've got some confidence in their utility. We'll use the S&P ETF's for tracking purposes.
****************
Weekly Trading Model:
50% SPY @ 245.59
50% Money Market
This week, Sentiment is again Bullish, and the Trend is unconfirmed Bearish. We will buy the SPY with the remainder of our cash at the open Monday. We are only 1/2 Long for the last Buy signal.
This model will start with the weekly sentiment, and then filter for Bull or Bear Market, and Intermediate-term Trend.
****************
Timer Digest Tracking Portfolio:
0% Money Market
50% SPY at 214.91
50% SPY at 215.04
We are 50% long the SPY at 215.04 and 50% long the SPY at 214.91.
*******************************************************
The above Portfolio/Trading Models do not represent an actual managed account nor a managed account program that we offer. This is only for tracking purposes for the KTT and Premium newsletters. Past performance is no guarantee of future returns. All information included in this missive is derived from sources we believe to be reliable, but no guarantee can be made to that effect. None of the forgoing should be construed as an offer or solicitation to buy or sell any security. The publisher may have a long or short position in the funds or securities discussed at any given time. We aren't your advisor, unless you have a signed contract with us. Please review any trade that you do with your trusted advisor FIRST.
---------------------------------------------------------------------------------
For more on using Wall Street Sentiment and the various sentiment data included, click here:
http://www.wallstree...Indicators.html
Mark Young
Editor
859-393-3335
818-MARKETS
If you would like to be removed from our list, simply reply with "Remove" in the body of the message. Leave the subject intact. Or you may call me directly at 859-393-3335 and I'll personally make certain your email is removed from our list.


