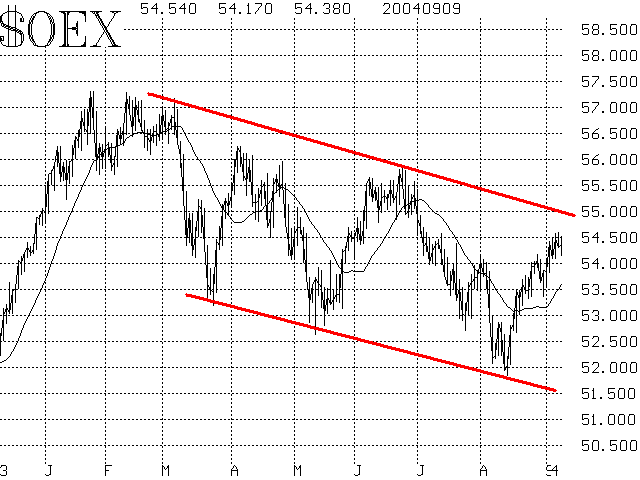
Our view on this rally has been that it is a short-term affair that will have trouble once the major averages reach the upper edges of their trading channels. We continue to hold that view, while allowing for the possibility that it could gain more momentum later.
The major averages have overcome resistance levels and climbed above their 20-day moving averages (that includes QQQ as well). Moreover, $SPX, $OEX, and the Dow ($DJX) have all risen above their 50-day moving averages and held that ground. The 50-day moving average is significant because many institutions use it (and the 200-day moving average) as guidelines.
Since we have not yet reached those aforementioned upper resistance levels, that means there is more room to go on the upside. Also, since we don't use targets, per se, we do allow for the possibility that the market will develop enough strength to plow on through that resistance (and all the other resistance from the February and March tops). That seems unlikely, but anything is possible as long as the buy signals remain intact.
Negative warning signs on the index charts would be 1) a violation of the 20-day moving averages, and 2) slipping below the support levels, which are roughly at the July lows.
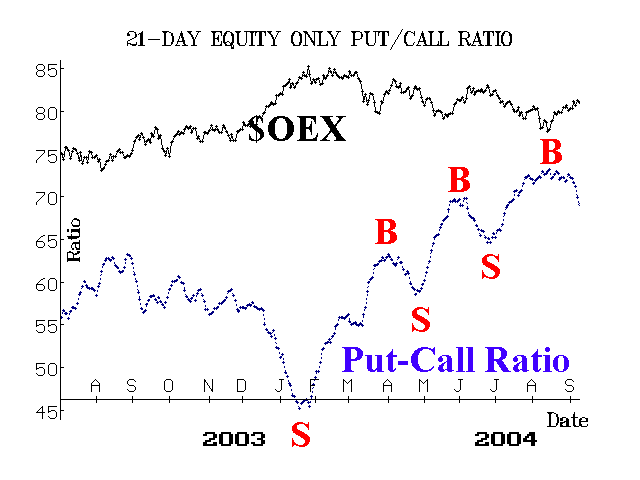
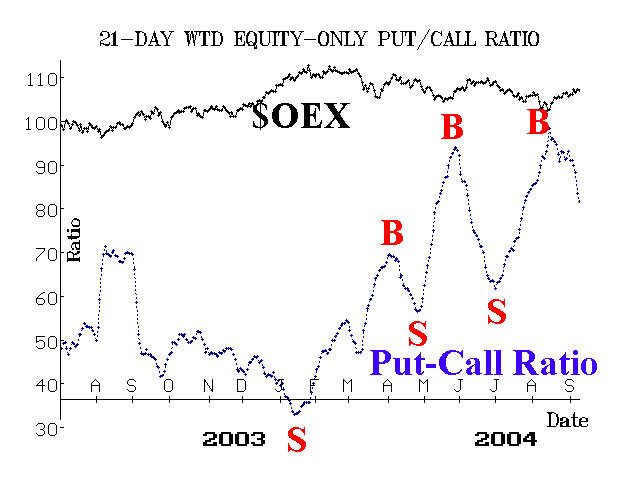
Equity-only put-call ratios have begun to drop quickly in the last few days. That is bullish. We had found it somewhat disconcerting that these ratios were hovering near their recent peaks -- especially the standard ratio (Figure 2). However, both the standard and the weighted (Figure 3) ratios are now plunging -- indicating that the market has room to rally until these ratios bottom and begin to rise. It doesn't appear that they will give sell signals, by bottoming, any time soon.
Market breadth has been relatively strong, and doesn't seem to be in imminent danger of issuing a sell signal, It would take several bad days to generate a breadth-based sell signal.
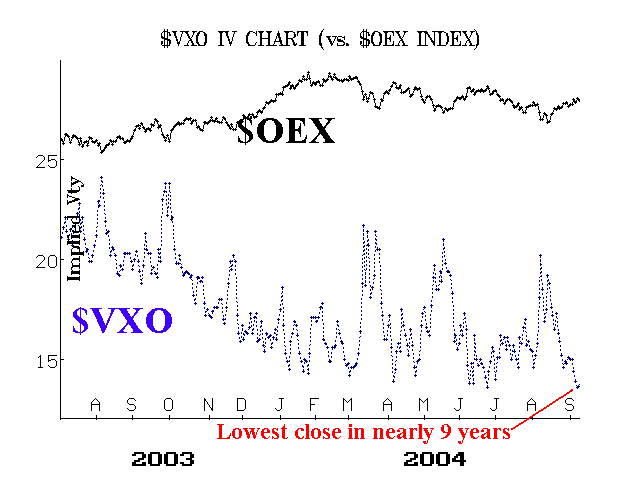
Finally, the volatility indices continue to decline -- albeit slowly. Recently, $VXO (the implied volatility index of $OEX options) made a new closing low -- the lowest reading in nearly nine years. $VIX isn't far behind. As long as these indices remain low or continue to decline, the market should be able to rally. Only if they climb by 3 points -- to roughly the 17 level -- would we consider that volatility has changed to a negative pattern.
In summary, with the technical indicators bullish, we expect the market to continue to work its way higher over the short term. However, we would encourage the taking of (partial) profits if the upper edges of the trading channel or resistance are hit. This would be $OEX in the 550-555 area, $SPX in the 1130-1140 area, and the Dow ($DJX) in the 10,400 - 10,500 range. We would not automatically turn bearish at those levels, though, unless we had accompanying sell signals from our technical indicators.


