
*Interview with Ike Iossif on October 14
For 30 to 90 days horizon: Sold long position in SPX on 10/18/04 at 1114.04 for a3.25% gain. Long SPX (8/10/04) at 1079.04. Sold long Nasdaq 10/18/04 at 1936.52 for 0.6%gain. Long Nasdaq (10/12/04) at 1925.17.
Short term trades, one day to one-week horizon: Flat.
What to expect now:
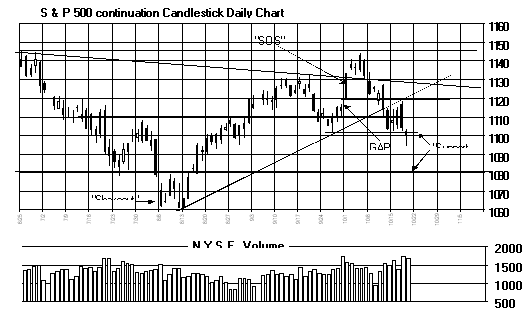
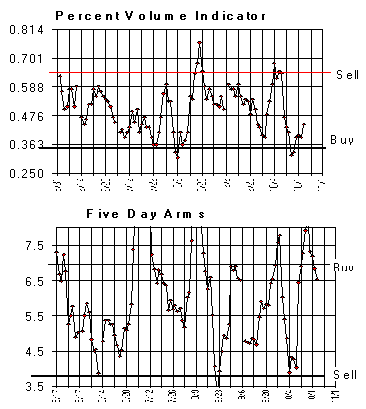
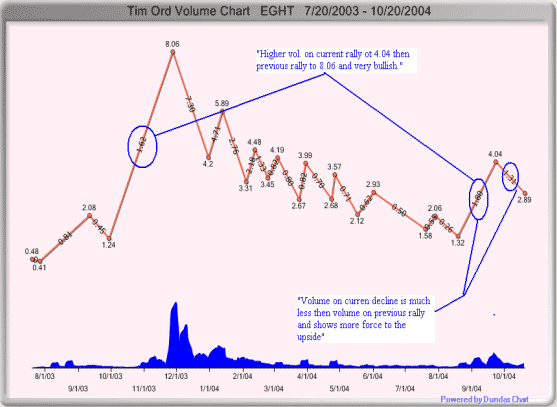
The NYSE McClellan Summation index is trending down and implies the trend is down for now. Today the S&P did trade below the recent lows set of over the last several daysand the low set on 9/28 near the 1100 level on good volume and suggest the market can movelower near term. However, the S&P was unable to hold the lows near the 1100 level andclosed above the 1100 level today where a possible bullish "Shakeout" could bedeveloping. The volume was on the heavy side today and markets don't make bottoms onheavy volume, heavy volume lows are always tested. If today's low is tested on lightervolume in the days to come, a bullish signal may get triggered near the 1100 level. Our"Percent Volume" indicator closed at .44 and in neutral territory and the"5 day ARMS" is still bullish at 6.54. The S&P for short term may driftuntil it becomes clear who the next president will be and that may before the election. Onthe bigger picture the pattern remains very bullish and a strong rally will start once aclear winner is in place and it appears a bull run will start no matter who becomespresident. Support comes in at today's low near the 1094 area and below that the nextsupport is 1080 area. Once the next buy signal is triggered, we expect the strongest rallyof the year to begin that should exceed the old 2002 high of 1175 before the year thisyear is out. To learn more on "Ord-Volume" please visit
Nasdaq Composite:
The Nasdaq McClellan Summation index is also in a downtrend and suggests this market has adown bias near term. Short-term support comes in at the previous low at the 10/15near the 1900 and the Nasdaq may generate a bullish signal at that level. The bigger trendis up and a strong rally is heading our way, probably after a winner is determined in theelection. Yesterday's high tested the previous high of 10/13 on near equal volume andsuggest at some point that high will be at least tested if not exceeded. Test of previoushigh on near equal volume is bullish. Test of previous highs on 10% or greater lightervolume is bearish. Therefore, yesterday's test is a bullish development. But sincethe Nasdaq was unable to hold the previous high, it should turn around and attempt to testthe previous low and the previous low is the 10/15 low at the 1900 level, which is ourdownside target. We are back to flat for now on the Nasdaq.
GOLD Market:
The XAU decline from the high of 10/8 near the 105 level appears to be a "Three GapPlay". The "Break away gap" appeared from 10/8 to 10/11. The "MidPoint Gap" formed from 10/11 to 10/12 and the final gap down called an"Exhaustion Gap" appeared on today's open. The "Exhaustion Gap" shouldbe the largest of the three gaps (which it was) and marks the end of the down-move. TheMarket should now reverse and at a minimum go back and fill the first gap near the 105level. It may go further then that. "Three Gap Plays" are not long term toppingpatterns but rather short term time outs in an up-trend. The worst case scenario is a testthe 10/13 low at the 96.50 area first before the XAU heads back up to the 105 range or wehead up now. Either case a bottom was made at the 96.5 level whether a re-testhappens or not.


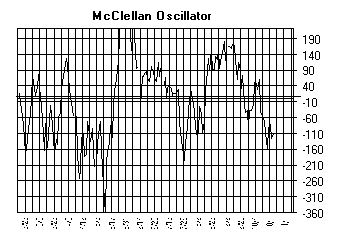
The McClellan Oscillator closed at -366 on May 10 and in an area where previousintermediate term lows has occurred. Today's close came in at -110 and in oversoldterritory.
The “Percent Volume” Indicator closed at .44and in neutral territory.
“Five day ARMS” indicator closed at 6.54 and in bullish territory.
Conclusion: Sold long position in SPX on 10/18/04 at 1114.04 for 3.25 gain. Long SPX on8/10/04 at 1079.04. Sold long position in Nasdaq on 10/18/04 at 1936.52 for gain of .6%.Long Nasdaq on 10/12/04 at 1925.17.
Longer Term Trend: Long SPX on 8/19/04 at 1091.23.


