
***Executive Summary***F
- Stock Market Stance Remains Neutral
- Volume Improves
- QQQQ Breadth is Strong
- QQQQ Exceeds Last Week's High
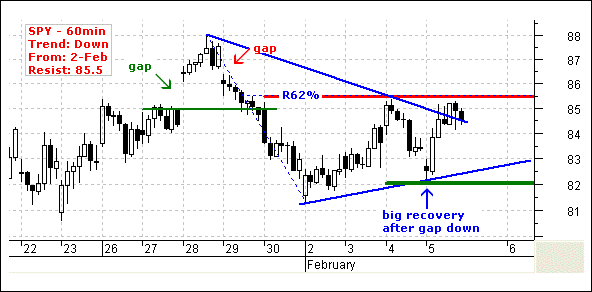
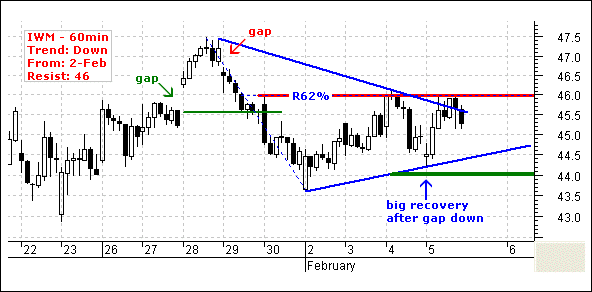
- SPY and IWM Hit Short-term Resistance
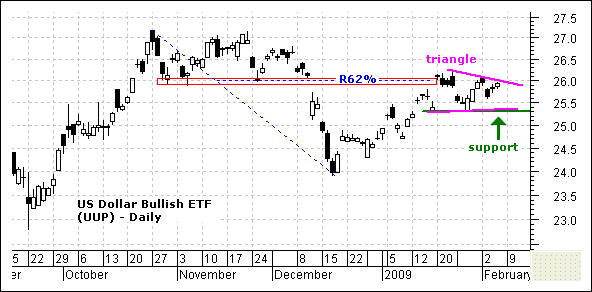
- UUP Stalls in Triangle
- GLD Surges Back above 90
- USO Firms at Support
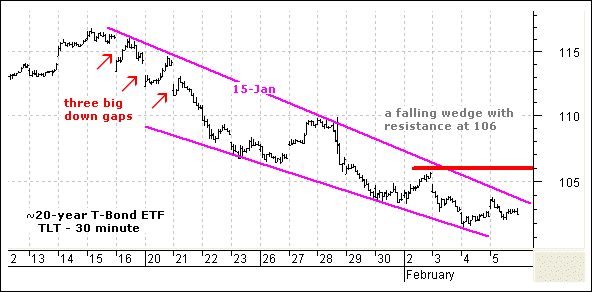
- TLT Tests Support Zone(video link)
Technically, the bulk of the evidence remains bearish. Negative breadth extremes were recorded in the second half of January and these have yet to be countered. Upside volume was pretty good on Thursday, but that was just one day and volume levels were still well below the highs seen in Sep-Oct-Nov. The major-index ETFs broke down in January, but only QQQQ staged a decent recovery. While relative strength in techs is promising, we need to see participation from the broader market to give this rally some muscle.
I remain a slave to the swings. Today's short-term swings are equivalent to medium-term moves in the old days (say the first half of 2008). Traders should expect whipsaws and small losses along the way, but hopefully one good trend will pay for all them all. Remember the whipsaw song? Click here it's well worth it!
Market moving events for the next few trading days:
- Friday: Employment Report!
-Earnings: Biogen Idec, Hillenbrand, Weyerhaeuser - Monday: Geithner Speech
-Earnings: Beazer, Whirlpool, Sohu, Vodafone - Tuesday: Wholesale Inventories
-Earnings: Elan, MolsonCoors, NVIDIA, Web.com - Wednesday: Crude Inventories
-Earnings: Agrium, Level3, PF Changes, Cymer - Thursday: Retail Sales, Jobless Claims
-Earnings: Aetna, Borg Warner, Marriott, Dryships - Friday: Consumer Sentiment
-Earnings: Abercrombie, PepsiCo, Cognizant Tech
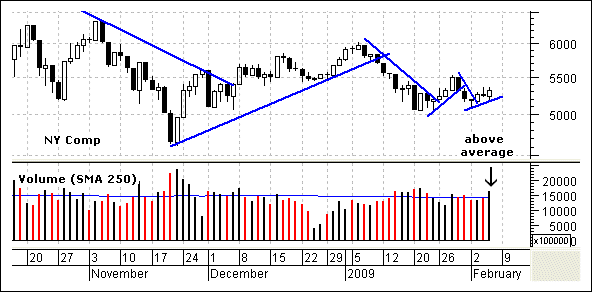
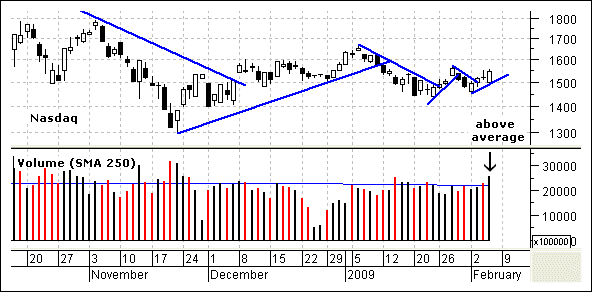
***Upside Volume Returns*** The Nasdaq and NY Composite moved higher on Thursday with above average volume. Nasdaq volume was the highest since late February. NYSE volume was above average, but just below the levels seen in mid January. Yesterday was in essence a reversal day as stocks opened weak and closed strong. Above average volume on such reversal days is bullish. The blue lines show the swings for the Nasdaq and NY Composite. Trading has been quite choppy with three swing reversals in the last three weeks. It looks like the current swings are up with support from yesterday's lows.
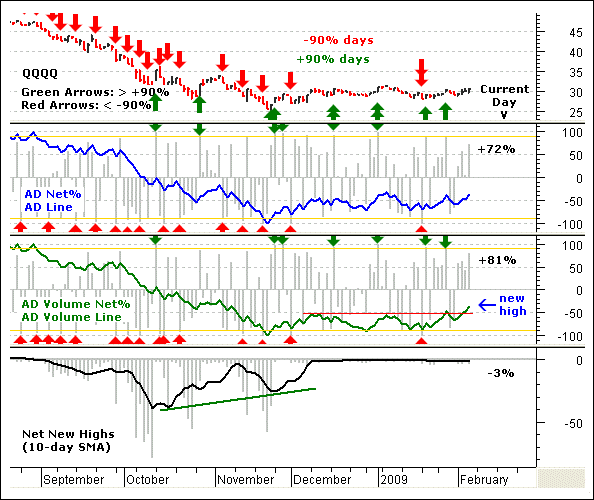
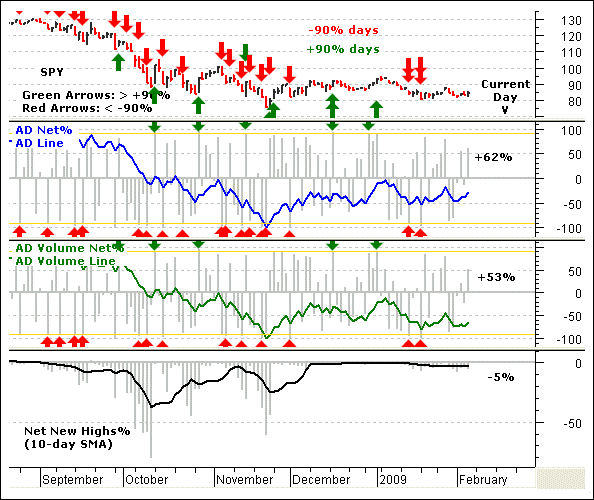
***QQQQ Breadth Is Strong*** Broad market breadth was modestly strong, but QQQQ breadth was much stronger. For the S&P 1500 ETF (broad market), AD Net% finished at +53% and AD Volume Net% ended at +51%. While respectable, these readings fell well short of a positive breadth extreme (greater than +90%). For the Nasdaq 100 ETF, AD Net% ended at +72% and AD Volume Net% finished at +81%. More techs are partaking in this rally. The AD Volume Line (green) broke above its December highs over the last few days and the volume leaders within QQQQ are showing the most strength.
***Major-index ETFs***
***Medium-term Trend*** The daily charts focus on the triangle formations of the last four months. After a failed surge last week, the major-index ETFs firmed at trendline support and bounced this week. SPY and IWM produced relatively feeble bounces, while QQQQ surged back above last week's high. QQQQ benefits from a complete absence of banking stocks. In addition, many tech companies have little debt and are still profitable. Companies with little or no debt are much better prepared to ride out a crisis. With the four day surge, QQQQ is on the cusp of a breakout at 31 that would reinforce the medium-term uptrend. With this week's bounce, I raised key support levels for QQQQ, SPY and IWM. These supports are now based on Monday's low. Failure to hold these lows would clearly break triangle support and reverse the medium-term uptrends.
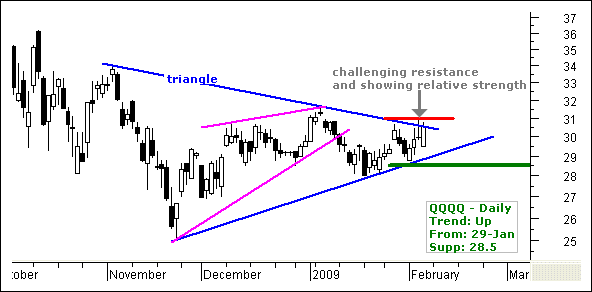
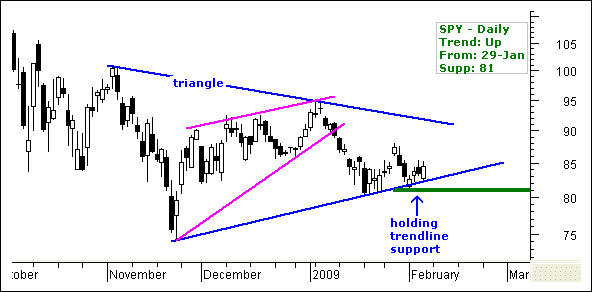
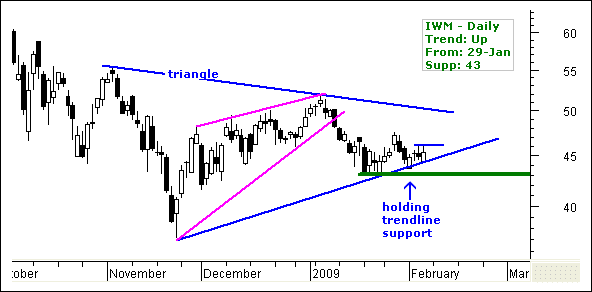
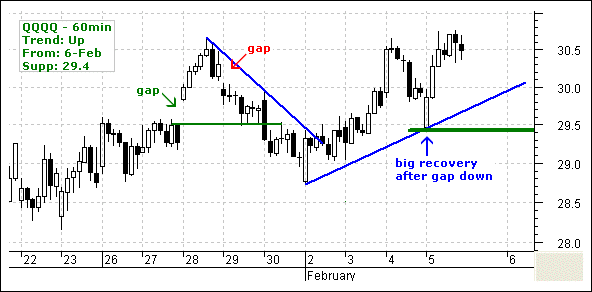
***Short-term Trend*** Just when you thought trading could not get anymore chaotic it did. QQQQ, SPY and IWM gapped down on the open, but firmed almost immediately and surged higher. QQQQ exceeded last week's high, but SPY and IWM hit resistance from a familiar spot. This means the trends/swings are now split. QQQQ is in a clear upswing, while IWM and SPY remain in downswings. Even though I could make a case for upswings in IWM and SPY, I prefer to wait for a confirming breakout. With the employment report on deck this morning, we are either going to breakout with a gap up or fail at resistance with a gap down. As yesterday proves, what happens after the gap is more important than the gap itself.
***Inter-Market Charts***
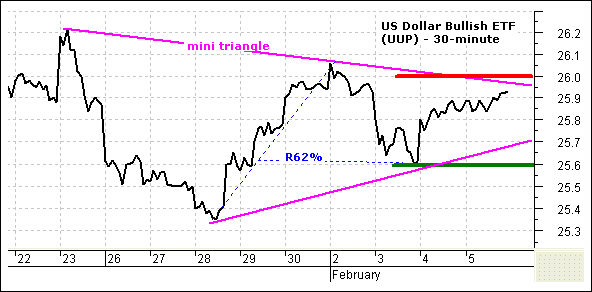
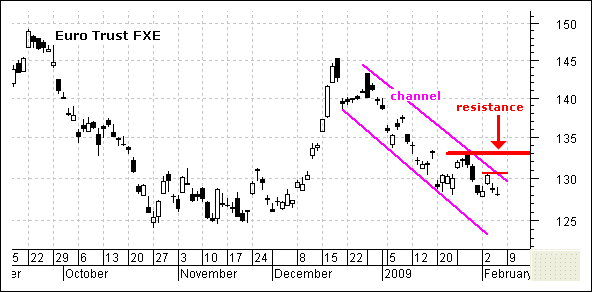
***Dollar*** Today's action is likely to be driven by the employment report. A surge in bonds and drop in rates would be bearish for the Dollar. A plunge in bonds and surge in rates would be bullish for the Dollar. As noted yesterday, be careful with the initial move (gap), especially if the Dollar opens sharply lower. The bigger trend is still up as the US Dollar Index Bullish ETF (UUP) consolidates within a triangle. A break below support at 25.3 would definitively reverse the uptrend. On the 30-minute chart, a smaller triangle is taking shape with support at 25.6 and resistance at 26. These are the first levels to watch for a break in the Dollar. The Euro Trust ETF (FXE) came under pressure again as the European Central Bank (ECB) elected to keep rates unchanged. Obviously, currency traders are not impressed with the ECB and sold the Euro. I am marking first resistance at 131. A break above this level would be positive, but we need to see a break above 133 to fully reverse the downtrend.
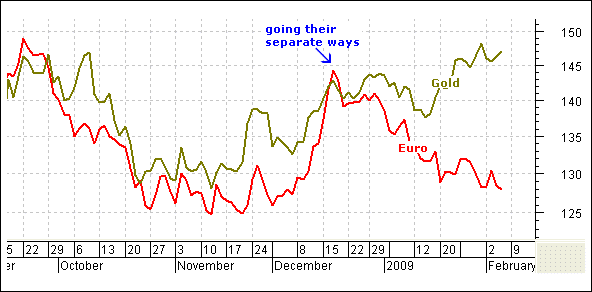
***Gold*** The streetTRACKS Gold ETF (GLD) could also be affected by today's employment report, but I am not sure how exactly. After a long period of positive correlation, gold and the Euro appear to be negatively correlated now. It all started in mid December when the Euro moved sharply lower (Dollar higher). Gold stalled for a few weeks, but then surged higher in the face of Euro weakness (Dollar strength).
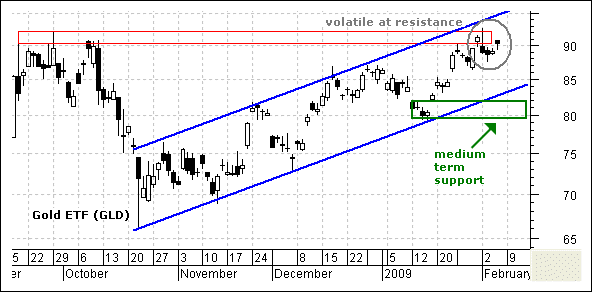
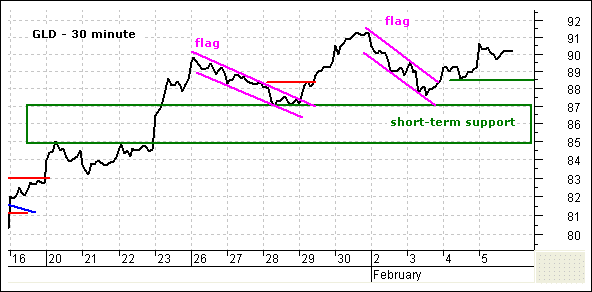
The streetTRACKS Gold ETF (GLD) remains in a clear uptrend on the daily chart. GLD hit resistance in the low 90s last week and trading turned volatile the last few days. This is not enough to affect the medium-term uptrend though. GLD is holding the majority of its gains and continues to show strength. On the 30-minute chart, GLD broke flag resistance on Wednesday and closed above 90 on Thursday. I am raising short-term support to 88.5. A break below this level would negate the flag breakout and put GLD back into a short-term trading range.
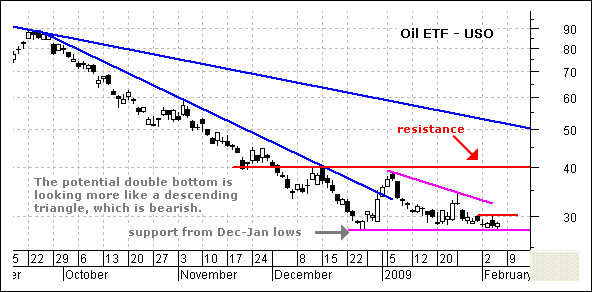
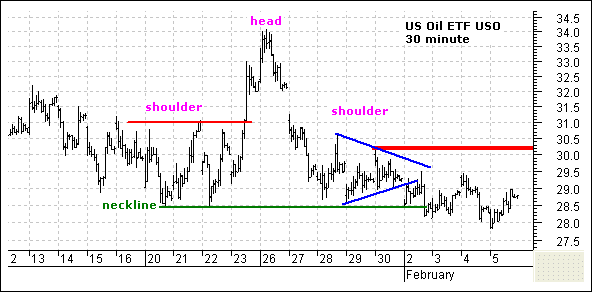
***Oil*** The fate of the United States Oil Fund ETF (USO) could also hang on today's employment report. A plunge in the Dollar and surge in stocks would be bullish for oil. The United States Oil Fund ETF (USO) continues to toy with support around 28 and keep the double bottom alive, but not yet kicking. USO needs a kick-start with a move above 30.2 at least. This resistance level is clear on the 30-minute chart. USO broke down on Monday and edged lower the last four days. Actually, the ETF has been edging lower since 28-Jan. There is a lot of resistance around 29.5-30 and I would like to see a break at 30.2 before anticipating a run towards the early January high around 39.
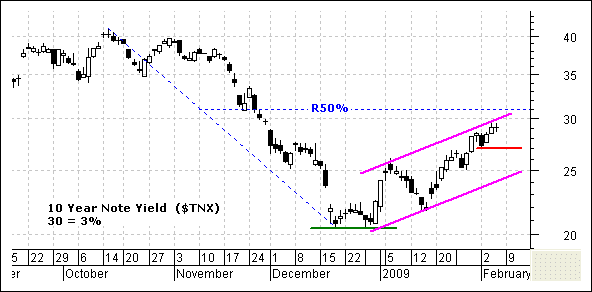
***Bonds*** The bond market is probably the most sensitive to the employment report because this report will influence Fed policy. A better-than-expected number and upward revisions, which do not seem likely, would cause bonds to plunge. A worse-than-expected number, which is more likely, could lift bonds. Not because the Fed will lower interest rates, but because further strains on the economy could prod the Fed into quantitative easing (buying bonds to push long rates down). The 10-Year Note Yield ($TNX) is at 2.9%, which is up from 2.05% in late December. An easy Fed cannot be happy with this bounce in long-term rates.
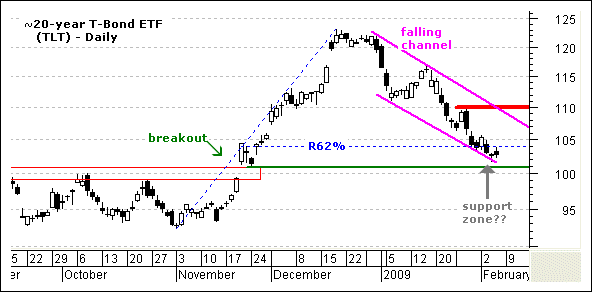
On the daily chart, the iShares 20+Yr T-Bond ETF (TLT) is trying to firm in a support zone bound by broken support and the 62% retracement mark. The ETF is short-term oversold after a plunge from 110 to 102, but shows no signs of strength. As far as the medium-term trend is concerned, a break above 110 is needed for a full reversal. On the 30-minute chart, I am marking short-term resistance at 106. This allows room for a gap and some upside noise without a breakout. In other words, I would look for follow through above 106 before taking any strength seriously.
Good day and good trading -Arthur Hill
---------------------------------------------------------------
Click here to post a comment, suggestion or question.
Breadth Charts ---------------------------------
---------------------------------------------------------------
Disclaimer: Arthur Hill is not a registered investment advisor. The analysis presented is not a solicitation to buy, avoid, sell or sell short any security. Anyone using this analysis does so at his or her own risk. Arthur Hill and TD Trader assume no liability for the use of this analysis. There is no guarantee that the facts are accurate or that the analysis presented will be correct. Past performance does not guarantee future performance. Arthur Hill may have positions in the securities analyzed and these may have been taken before or after the analysis was present.
--------------------------------------------------------
about: The Daily Swing is posted every trading day around 6AM ET and focuses on short-term strategies for QQQQ, SPY and IWM. In addition, at two stock setups are featured every day with a detailed trading strategy. As warranted, coverage extends to broad market topics, key sectors and industry groups and inter-market securities (gold, bonds, the Dollar and oil).
--------------------------------------------------------
Sources: Data from Bloomberg.com, CBOT.com, Kitco.com and ino.com; Charting from Metastock (equis.com). Closing data from Reuters.com, eSignal.com, MS QuoteCenter and Yahoo! Finance.


