

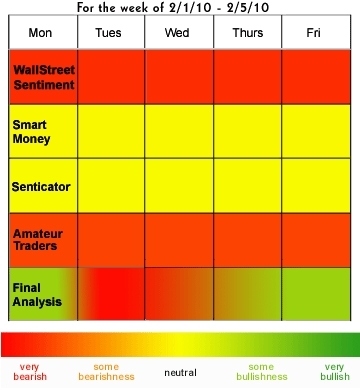
Wall Street Sentiment Daily for 2/01/10
Institutional Sentiment and Analysis
Monday 2/01/2010 at 9:10 am
By Mark Steward Young
Short-Term Sentiment: Mixed.
Overall Intermediate-Term Sentiment: Mixed for the market.
Individual Investor Sentiment: Mixed-to-Bullish for the market.
Small Speculator Sentiment: Mixed for the market.
Small Hedge Fund/Manager Sentiment: Mixed for the Market.
Longer-term Trend:
Bull Market Condition.
Intermediate-term Trend:
Negative. Confirmed.
Short-term (one-day) Signal:
None. Looking both ways.
We are trading these signals and others intra-day for our Premium subscribers--contact us for details ( http://www.wallstreetsentiment.com/contact.html).
Ideal ETF Portfolio (tracking portfolio):
25% QLD at 34.30
50% QID at 33.21
25% QLD at 26.09
We've adjusted the hedge (re-balanced) as of 10/22/09. We may take off part of the hedge.
*******************************************************
The $-weighted SPX P/C is high while the other P/C's aren't. That's bad news for the market. Smart money is preparing for a dump. The Weekly Fearless Forecaster poll has a ton of Bulls. I smell a fake out today; an "Up Monday" that isn't.
********************************************************
Message Board Sentiment
The message board sentiment poll now shows Bulls at 27% and Bears at 49%. This is just barely Bullish since while this crew tends to be right, over 50% is a fade and it was there all weekend long. Participation was normal. The Actual Position Poll shows 22% fully long and 22% partially long. 10% are partially short and 27% are fully short. This is above my 20% threshold, and that is Bullish. The FL/FS 1-day is still neutral. I'm worried about so many partially long Bulls--they're a juicy target for "the Boyz"... The FL/FS 5-day Fully Long/Fully Short ratio is still in Buy territory. The Weekly Fearless Forecasters poll is showing 70% Bulls. That's likely a problem for the market this week, too.
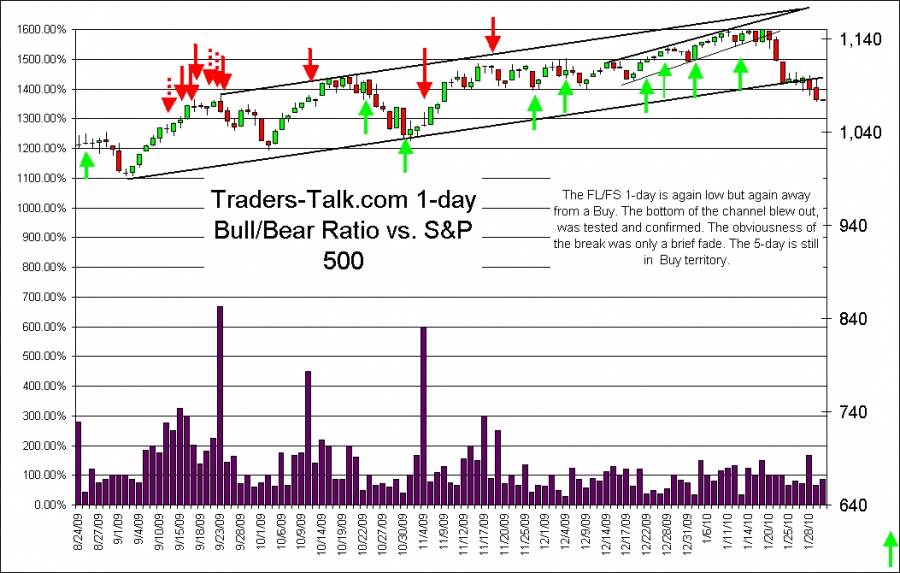
Check out www.traders-talk.com for early updates of the sentiment polls every day and overnight.
Our T-4 Turn Indicator went out at 61, which is very good activity. Typically we want to see readings above 70 or higher (now that we've made changes to the posting guidelines). Still, this is among a few of the highest readings we've seen in some time, it may be close enough to a signal, too. Maybe a Buy? This indicator doesn't catch every top and bottom, but it is a great "Heads up!" indicator.
Following is a recap of the weekend letter:
Proprietary Surveys
This week, the WSS Surveyees are rather pretty Bearish, but even more neutral. Who can blame them? The "Smart Money" is rather neutral and the "Amateur" pollees are a bit Bearish, though none are too terribly Beared up. The Senticator is neutral and no help. The lack of Bearishness among the Amateurs is problematic. It certainly doesn't preclude a bounce, but it may not be helpful for making a meaningful low. There are enough Bears in the polls to get a bounce, but I fear that's about it.
Options Sentiment
Daily P/C ratio: 1.00. Weak Buy.
10-day P/C ratio: 0.91. Neutral.
Equity P/C ratio: 0.73. Weak Buy.
OEX PC ratio (not a fade): 0.97. Weak Buy.
OEX 10-day PC ratio: 1.40. Negative.
OEX $-weighted* P/C ratio: 1.55. Neutral.
NDX $-weighted* P/C ratio: 0.25. (!!) Sell.
QID (Ultra Short QQQQ) P/C ratio: 0.17. Buy.
SDS (Ultra Short SPX) P/C ratio: 0.23. Neutral.
ISEE Sentiment Index: 121. Neutral.
10-Day ISEE Sentiment Index: 109. Neutral. (H/T to persistent subscriber)
Relative VIX: Neutral.
Daily VIX: Buy.
The P/C's are odd, especially the $-weighted NDX--again, this time quite Bullish. The PEX is also Bullish, however. What I'm worried about is that the $-weighted SPX P/C is quite high while the other indices are not. That's usually a bad sign. I think that the OEX is telling us to look for a quick rally, but one that won't last and that we could get a surprise shellacking. Market Harmonics' Options Buyers Sentiment Gauge (thank you, Tony Carrion http://www.market-harmonics.com) is just off of a Sell. Most options indicators are contrary; if folks are buying calls, we want to fade them and go short. The OEX nominal P/C is an exception, because the OEX traders tend to be right, unless they are paying up for options (which will show up in the $-weighted data).

(If the chart is corrupted, use this link: http://www.market-harmonics.com/images/tec...nt/obsglong.gif )
The ISEE Sentiment Index indicator is contrarian; traditionally, over 200 is too optimistic, under 100 is too pessimistic. *$-weighted P/C data courtesy of Fari Hamzei of www.hamzeianalytics.com . Readings over 2.0 are Bullish and near 0.5 are Bearish. OBSG provided by Tony Carrion of Market Harmonics.
General Public Polls
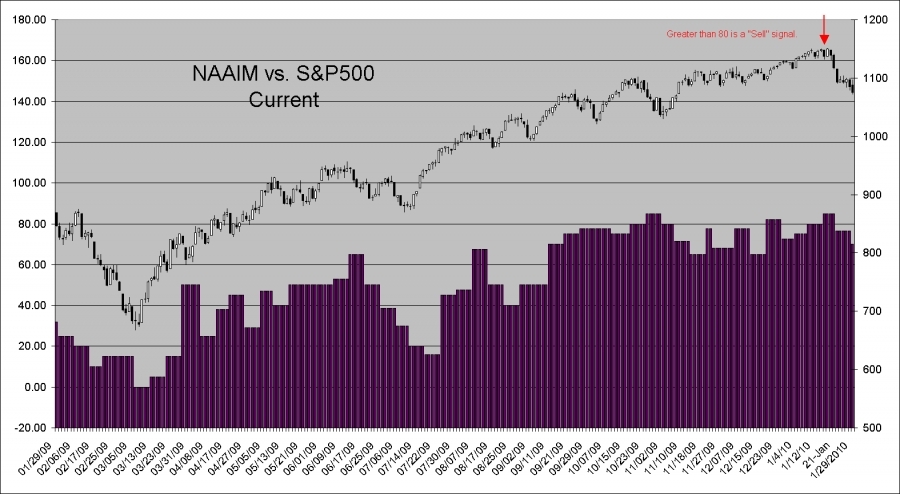
The National Association of Active Investment Managers (NAAIM) Sentiment Survey shows the median market exposure is at 70.0% down from 76.5%. This is neutral. The last signal was a big winner and nailed the top within 10 points. For more on our analysis, see this brief study http://www.traders-talk.com/mb2/index.php?...t=0#entry502593 .
TSPTalk reported 41% Bulls and 46% Bears. That's technically a Buy by their new measures, but I think we need a more dramatic reading in order to get Bullish based upon this sentiment. This is still almost an even split, and given the damage that has been done I'd call that consistent with a continuation of the trend, which is down. They are now using their Bull Market Filter.
Last Week, AAII reported 35.00% Bulls and 36.67% Bears. That's a good shift in Bearishness and that's also a Buy. I'm both pleased and surprised. Last week, we had 40.00% Bulls and 34.74% Bears.
Investors Intelligence reported 40.00% Bulls and 23.3% Bears vs. 52.2% Bulls and 18.9% last week, which is a big shift and is a short-term Buy (as are almost all big Bearish shifts). This is out of the Sell zone too and moving in the direction that Bulls should like.
Newsletter Advisors dropped to 40% net long, which is a good drop and probably good for a bounce but Naz advisors held at 57% Long and that's not good after a decline such as we've just had. This is Bearish, after a bounce.
Lazlo Birinyi's site, Tickersense, reported 43.75% Bulls and 37.50% Bears. That's a big jump in Bullishness, after an ugly decline. Uh-oh...
RealMoney Poll was showing 37% Bulls and 50% Bears, last week. That still seems like too many Bulls given the damage, but it's getting better. The poll is not available currently.
Conclusion
Last week, I said that the Sentiment picture had improved, but not enough. The big concern was the utter negativity of the technicals. We can see how it played out. The Sentiment picture has improved some more, but again, not enough. Now, we need to remind you that with the Weekly MACD cross-over, we need to be alert for a bounce of some magnitude and/or duration. Currently, it would seem to be too early for a sustained rally, but one of our best bottom-spotters is telling us that a turn is soon to come. My thinking here is that we are going to bounce on Monday, but that we're going to get a scary or demoralizing decline thereafter. That "should" generate enough pessimism to trigger a rally to fulfill the "Best Fade" Buy from the Weekly MACD. I have no idea if that will be a week+ bounce within a larger decline, or if we will bottom the correction. I'm calling a rally on Monday, that may or may not hold the day. Then I see a sharp decline that takes the market down on Tuesday and perhaps Wednesday. I am suspecting that Thursday will be up and probably Friday too.
We are on twitter and we offer comments and trade updates throughout the day as we have time or as we see sentiment of interest. You can follow us at http://twitter.com/WallStSentiment .
The Mechanical Senticator and Subjective Models will both sit flat. Remember, these models must trade in the direction of the Senticator or not at all. In case you haven't been keeping track, we just figured that the Senticator has outperformed the market by 58% over the past 3 3/4 years and is up nicely (15%) this year--that's with no leverage and few shorts.
We are looking both ways. Since we've been publishing our ST Sentiment Signals, we've had 143 trades and 95 winners. If you'd like a trial, feel free to contact us ( http://www.wallstreetsentiment.com/contact.html).
****************
Ideal ETF Portfolio (tracking portfolio):
25% QLD at 34.30
50% QID at 33.21
25% QLD at 26.09
We have adjusted the hedge as of 10/22. We may take off part of the hedge.
*******************************************************
Past performance is no guarantee of future returns. All information included in this missive is derived from sources we believe to be reliable, but no guarantee can be made to that effect. None of the forgoing should be construed as an offer or solicitation to buy or sell any security. The publisher may have a long or short position in the funds or securities discussed at any given time. We aren't your advisor, unless you have a signed contract with us. Please review any trade that you do with your trusted advisor FIRST.
---------------------------------------------------------------------------------
Note that we are publishing on our private area on Traders-talk.com, providing on-line access to our charts and research. The password is at the top of this letter.
http://www.traders-talk.com/mb2/index.php?showforum=47
(you'll need to register and sign in on Traders-talk and you'll need an additional password to access the board. If you are a subscriber and you do not have a password, please contact us).
For more on using Wall Street Sentiment and the various sentiment data included, click here:
http://www.WallStreetSentiment.com
Mark Young
Editor
859-393-3335
818-MARKETS


