

Wall St. Sentiment Weekly 5/23/10
Institutional Sentiment & Analysis
Published Sunday 5/23/2010
By Mark Steward Young
Short-Term Sentiment: Bullish.
Overall Intermediate-Term Sentiment: Mildly Bearish for the market.
Individual Investor Sentiment: Mixed to Bullish for the market.
Small Speculator Sentiment: Bullish for the market.
Small Hedge Fund/Manager Sentiment: Mixed for the Market.
Longer-term Trend:
Bull Market Condition.
Intermediate-term Trend:
Negative. Confirmed.
Short-term (one-day) Signal:
None. Looking long, with care.
We are trading these signals and others intra-day for our Premium subscribers--contact us for details
(http://www.wallstree...om/contact.html).
Ideal ETF Portfolio (tracking portfolio):
25% QLD at 34.30
50% QID at 33.21
25% QLD at 26.09
Look to take off part of the hedge. We'll advise.
*******************************************************
We are on a Buy from the Relative VIX. This is the first signal since last year. TSP is also flashing a strong Buy. Many longer-term indicators aren't in Buy territory, but they can catch up. We're beneath the 200-day, but it is up trending. This is generally a ST Buy. Short-term, there may be a few too many Bulls a bit too quickly.
********************************************************
Results of the Wall Street Sentiment Survey (formerly known as the Fearless Forecaster Sentiment) taken after the close on 5/21/10
Response was to this question: "At the end of next week will the S & P 500 close up (bull), down (bear), or unchanged/no opinion (neutral)?"
Weekly BULLS: 57%
Weekly BEARS: 21%
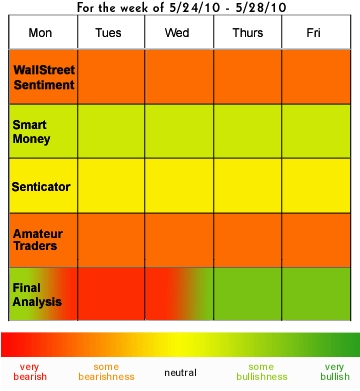
Our `Smart Money' Pollees were 100% Bullish and 0% Bearish.
Our Amateur Trader Pollees were 33% Bullish and 0% Bearish.
The Senticator Signal: Neutral.
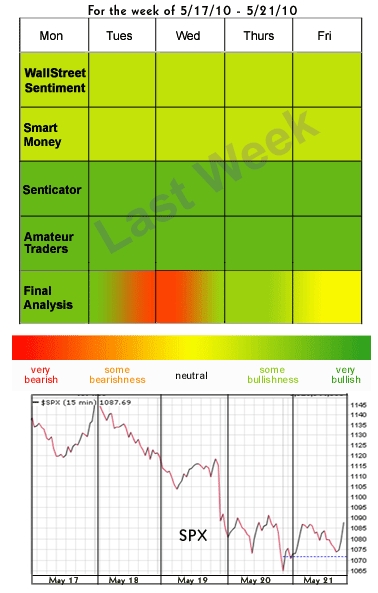
Last time, our call was for a rally on Monday and into Tuesday, a pullback into a low on Wednesday and a rally on Thursday, with Friday showing a bit of chop. We said, "We can end the decline this week, at least in theory." The market rallied (with difficulty) on Monday and into Tuesday, pulling back late, then falling all the way into Friday before rallying. Basically, we were a day off and we had the general shape of the thing right. I think we can take a B+ for that call. Remember, these predictions are for demonstration purposes and are not a substitute for trading discipline.
The Mechanical and Subjective Senticator Models went 1/2 long at 114.19. Bought another 1/2 at 104.54, per the daily letter on Friday. We went out at 109.11 (almost break even) but we advised that folks hold over the weekend. Note that the Senticator Models are based upon only one indicator and do not reflect our overall opinion which may change during the week. If the Senticator is Bearish or Bullish, the Mechanical model HAS to go short or long.
Proprietary Surveys
This week, the WSS Surveyees are rather Bullish. The "Smart Money" guys are a 100% Bullish, and the "Amateurs" were a little bit Bullish. This is a little iffy. There are an awful lot of Bulls. Granted, the Amateurs are pretty neutral, but this isn't really Bullish for the market. The Senticator is Neutral.
Message Board Sentiment
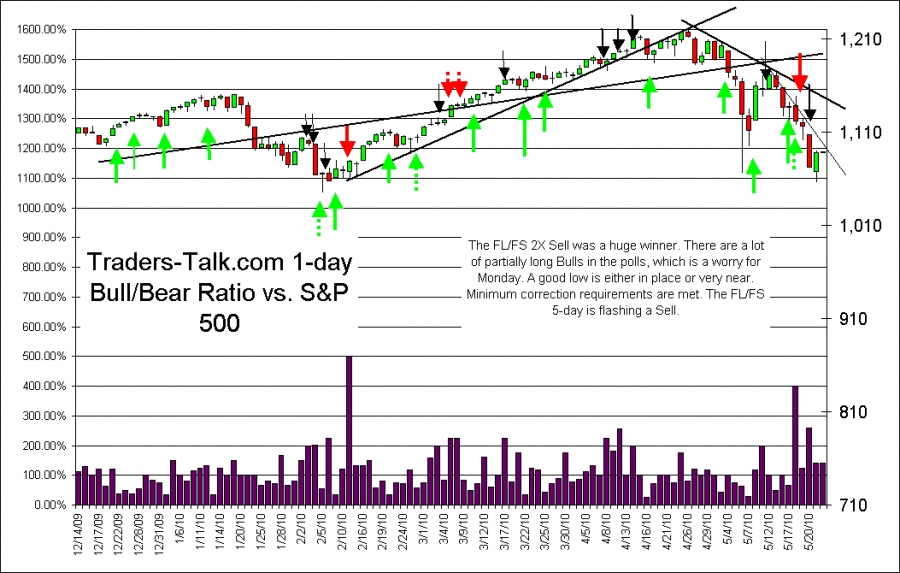
The message board sentiment poll now shows Bulls at 45% and Bears at 34%. This is technically Bullish since this crew tends to be right, at least for a bit, but this is a lot of Bulls. Participation was a bit above normal. The Actual Position Poll has 24% fully long and 28% partially long. 14% are partially short and 17% are fully short. This is below my 20% threshold and is Bearish for the market. The FL/FS 2X Sell last week was a big winner. We again have a lot of partially long Bulls, which may be a problem, now that we have what looks like a turn. The 5-day Fully Long/Fully Short (FL/FS) ratio is in "Sell territory", but I'm not sure how long that will last. The Weekly Fearless Forecaster poll has 63% Bulls, implying a possible shot down.
Check out www.traders-talk.com for early updates of the sentiment polls every day and overnight.
Our T-4 Turn Indicator went out at 63, which is good activity, but away from a signal. Typically we want to see readings above 70 or higher (now that we've made changes to the posting guidelines). This indicator doesn't catch every top and bottom, but it is a great "Heads up!" indicator.
Options Sentiment
Daily P/C ratio: 1.32. Strong Buy--Just off a 30 month high.
10-day P/C ratio: 1.12. Buy. This is as low as it has been in over 20 months.
Equity P/C ratio: 0.88. Strong Buy. 18 month high.
OEX PC ratio (not a fade): 0.89. Weak Buy.
OEX 10-day PC ratio: 1.06. Buy.
OEX $-weighted* P/C ratio: 0.28. Strong Sell.
NDX $-weighted* P/C ratio: 1.14. Neutral.
QID (Ultra Short QQQQ) P/C ratio: 0.24. Neutral.
SDS (Ultra Short SPX) P/C ratio: 0.38. Sell.
ISEE Sentiment Index: 64. Buy. Very low.
10-Day ISEE Sentiment Index: 93. This is Bullish. (H/T to persistent subscriber)
Relative VIX: Buy.
Daily VIX: Buy.
The P/C's are Bullish, though I have some worries, especially from the $-weighted OEX and SPX P/C's. The OEX is flashing a strong Sell and the SPX is quite high. In the last Bear market that indicated smart money hedging. Of course, Friday was Op-Ex, so we should take it all with a grain of salt. The big news last week was the relative VIX which closed Thursday higher than any time since December 1 2008, right before a 100 point rally. If Friday didn't bottom this thing, we're likely to this week. Market Harmonics' Options Buyers Sentiment Gauge (thank you, Tony Carrion http://www.market-harmonics.com) is neutral.
Most options indicators are contrary; if most folks are buying calls, we want to fade them and go short and vice versa. The OEX nominal P/C is an exception, because the OEX traders tend to be right, unless they are paying up for options (which will show up in the $-weighted data).
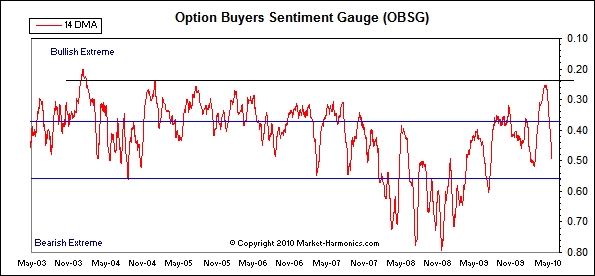
The ISEE Sentiment Index indicator is contrarian; traditionally, over 200 is too optimistic, under 100 is too pessimistic. *$-weighted P/C data courtesy of Fari Hamzei of www.hamzeianalytics.com . Readings over 2.0 are Bullish and near 0.5 are Bearish. OBSG provided by Tony Carrion of Market Harmonics.
General Public Polls
TSPTalk reported 25% Bulls and 66% Bears, vs. 51% Bulls and 35% Bears last week. That's a Buy by their new measures, and that's the type of reading that I was looking for. That's a Buy in my book too. They are now using their Bull Market Filter and it has been doing pretty darned well for them.
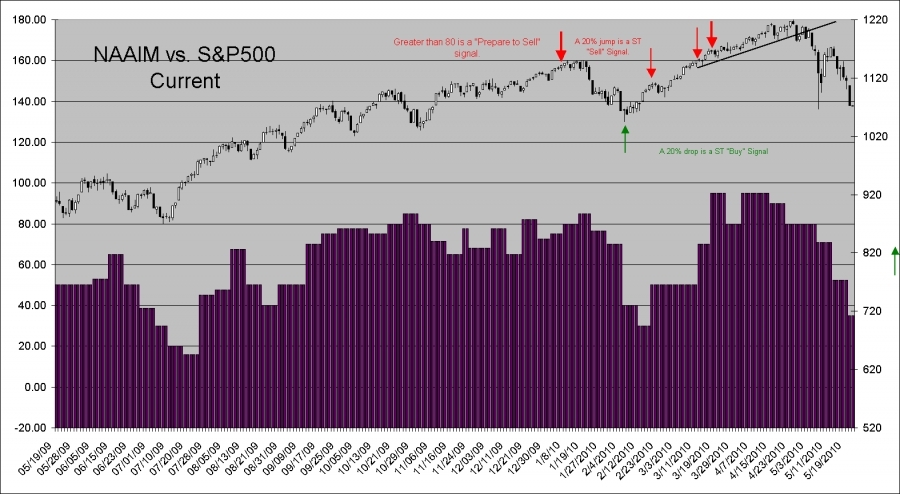
National Association of Active Investment Managers (NAAIM) Sentiment Survey reported that the Median market exposure dropped from 52.50% to 35%, which is again nearly a Short-term Buy (a 20% or greater drop), but not quite. It's also nearly into Buy territory. Short term, this might be a little Bullish, but not too much. The Mean exposure dropped to 40%, which is OK, but not exciting. Unfortunately, the maximum long exposure of +200% shows at least a little too much aggressive bottom picking. My read is that if I don't have any of my better bottom-pickers on Buys, they're probably premature. So far, no signs of a low and no Buy.
For more on our analysis, see this brief study http://www.traders-talk.com/mb2/index.php?showtopic=115139.
AAII reported 41.30% Bulls and 33.70% Bears. That's a jump in Bullishness and a drop in Bearishness. This is very bad news. In a market that has broken, we have a growing number of complacent Bulls. It is probably too soon to look for a good low. Last week, we had 36.60% Bulls and 36.60% Bears.
Investors Intelligence reported 43.8% Bulls and 24.7% Bears vs. 47.2% Bulls and 24.7% Bears last week. That's a decent drop in Bulls no change in Bears. This is Bearish, in the context of the current ugly market..
The Newsletter Advisors turned a little more Bullish rising to 19.9% net long from 17.4% last week. This is a small rise and is reasonably Bullish. Naz advisors remained just 3.2% long. After a dramatic a Bearish shift last week. This is generally consructive for the Market.
Lazlo Birinyi's site, Tickersense, reported 46% Bulls and 31% Bears vs. 53% Bulls and 40% Bears last week. That's a good drop in Bulls and a good drop in Bears. Still, that's probably more Bullishness than the market needs right now. It's not much of a tell, but it's too Bullish.
RealMoney Poll is not available currently.
Conclusion
Last week, I said that while I expected a little bounce on Monday and Tuesday, I was pretty confident that we were not yet done with the weakness. Um, yeah. Pretty true, that. We were looking for the market to take out 1094 and it did (by quite a lot). Thursday night, however, the game changed. For the first time in a long time, we got some outlandish sentiment readings save for AAII and II (which weren't near Buys, but which can play catch-up). TSP gave a very Beared up 66% Bearish reading, too. Most importantly, the Relative VIX was flashing a Buy. The last time it did that (and from a very similar reading) was on Dec. 1, 2008, right before a 120+ point S&P rally. So, is the low in? Well, maybe, but the signature wasn't really a good one. Sure, we should have bought the pivot low and seen what happened, but caution was still indicated. My thinking here is that they've got some chop left. I'd not be surprised that the print low is in place, but until we break and turn the hourly trend up, I think we want to be a little bit careful, still. The options are a little bit scary, too. The SPX $-weighted P/C is high and everything else is constructive. That used to be a reliable Sell signal during the last Bear. I wanted to note one thing of interest for the Weekly Subs; we closed beneath the rising 200-day SMA, and there are a lot of simplistic systems that will sell on that. I've found that it's really a pretty good head fake. I'd take pretty much any buy after the first break of the rising 200-day. We are not yet in a Bear market. My call for the week is for a rally Monday that fades and then a sell off down into a low on Wednesday and a nice rally into week's end. If we get a nice bottoming signature earlier in the week, buy that.
We've changed the chart below for clarity. The color in the chart indicates the Bullishness or Bearishness for the market. This eliminates the need for interpretation. If the Smart Money or the Amateurs are green, then you can conclude that such is Bullish for the market.
We are on twitter and we offer comments and trade updates throughout the day as we have time or as we see sentiment of interest. You can follow us at http://twitter.com/WallStSentiment .
The Mechanical Senticator Model and the Subjective Model are already long from 114.19 and 104.54. We had anticipated another Buy, but we don't have one. Sell these positions at 109.75. Stop this at 107.75. We may adjust the stop early on Monday, too, by alert. Remember, these models must trade in the direction of the Senticator or not at all. In case you haven't been keeping track, we just figured that the Senticator has outperformed the market by 58% over the past 3 3/4 years and is up nicely (15%) this year--that's with no leverage and few shorts.
We are looking both ways. Since we've been publishing our ST Sentiment Signals, we've had 157 trades and 103 winners. If you'd like a trial, feel free to contact us ( http://www.wallstreetsentiment.com/contact.html).
****************
Ideal ETF Portfolio (tracking portfolio):
25% QLD at 34.30
50% QID at 33.21
25% QLD at 26.09
We look to take off the hedge.
*******************************************************
Past performance is no guarantee of future returns. All information included in this missive is derived from sources we believe to be reliable, but no guarantee can be made to that effect. None of the forgoing should be construed as an offer or solicitation to buy or sell any security. The publisher may have a long or short position in the funds or securities discussed at any given time. We aren't your advisor, unless you have a signed contract with us. Please review any trade that you do with your trusted advisor FIRST.
---------------------------------------------------------------------------------
If you'd like to receive the Wall Street Sentiment Daily, you'll need to make sure to order at this link (please indicate your subscriber status in the "notes").
http://www.wallstreetsentiment.com/order.html
If you are a KTT or Institutional subscriber, your Wall St. Sentiment Daily and Premium upgrade subscription is included.
For more on using Wall Street Sentiment and the various sentiment poll data, click here:
http://www.wallstreetsentiment.com/d/i.html
Mark Young
Editor
ABOUT SENTIMENT AND ANALYSIS
The Wall Street Sentiment Survey is taken each Friday from a generally static pool of experienced technical analysts (both private and professional). The Wall Street Sentiment Surveyees are not normally a good fade, though there are times when they can be.
The Wall Street Sentiment Survey data are useful on the short term; they tend to be right. Typically they are right sooner rather than later, if there's a large plurality. On the flip side of the equation, if 90% or more are Bullish or Bearish, the odds of them being right over the very short term are huge, but the odds of a major turn (in the opposite direction) soon thereafter are also quite good.
We have also found that when the Wall Street Sentiment Surveyees are evenly split, look for a BIG move in either direction, but usually down.
Over the years, we have found a number of other tools to help in evaluating the Wall Street Sentiment Survey. We publish this in our Wall St. Sentiment Weekly (a part of our institutional research). These additional tools are our "Smart Money" poll, Amateur Trader survey, and our Senticator. All are proprietary surveys conducted by us.
We have found that the Senticator tends to be right by the end of the week (as much as 82.7% of the time), though it tends to be more accurate in a rising market than a falling one.
The "Smart Money" pollees are very useful when there is divergent opinion. It's generally NOT a good idea to fade the "Smart Money" unless "'EVERYONE'" (all sentiment measures) is in agreement. When in doubt about the meaning of the Wall Street Sentiment Survey, defer to the "Smart Money" poll or fade the "Amateur Survey". The "Smart Money" guys are folks with whom I've worked or whom I've watched for YEARS. They all have different approaches and they're all VERY good (not infallible, just good analysts/traders).
The Amateur Surveyees are your classic more emotional traders who tend to be wrong when they are heavily leaning in any one direction--which is often at a turning point.
In addition to these surveys, we chronicle multiple other polls and surveys including those conducted by our sister firm, Traders-Talk.com. We also review options data and fund shifts at Rydex. Additionally, we are also the sole publishers of the T-4 indicator created by Traders-talk--which is a fantastic turn indicator.
Subscriptions to Institutional Sentiment and Analysis are $99 per year. This also includes special sentiment updates and reports. Our polls are unique and insightful, and our analysis is some of the most accurate on the Street.
Order today by calling 859-393-3335 or order on-line at
http://www.wallstreetsentiment.com/order.html


