

This is from our letter dated June 1, 2010
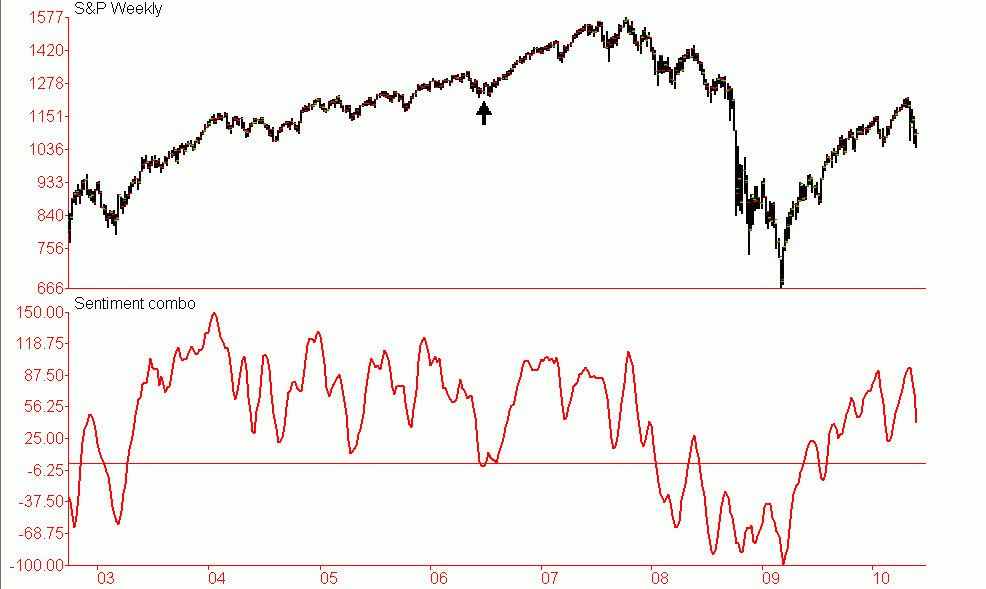
With the averages breaking slightly below their early May lows last week we have seen further improvement in a number of sentiment indicators. Investors Intelligence for example reported the highest percentage of bears since late July. Our key indicator based on this survey is still slightly bearish but it is poised to continue to improve for several more weeks. What is important here is to see how quickly the majority is to jump on the bearish bandwagon. This can also be seen from the latest numbers from the American Association of individual investors as the bears came in at 51%, its highest one week reading since early November of last year. Our key medium-term sentiment indicator is the our sentiment combo which, as the name implies combines AAII, Market Vane, Consensus Inc. and Investors intelligence into one indicator. As we can see on the chart below this key indicator has moved close to where it stood in late February. It can and probably will improve further over the coming weeks but it has done all it needs to do to correct the excesses that had built up over the past thirteen months. We can see that during the 2003-2007 bull market that this indicator moved below a zero only once during corrections. That occurred in June 2006 and was followed by what may have been the best and most persistent rally of that entire bull market.
The point here is that sentiment indicators in bull markets do not have to move back to bullish levels. All they need to do is correct some of the excesses from the preceding rally. This is being accomplished in these indicators while shorter-term indicators such as the put to call ratios are back to extremely bullish levels. In the case of the CBOE put to call ratio both the 10-day and 21-day moving averages are at their highest level since late October of 2008. Yes the market continued to move lower form late October but at the same time that spike in the put to call ratios followed a one year decline and a loss of over 45% in the S&P. The current decline is only slightly over one month old and the S&P at its worst was of 14%.
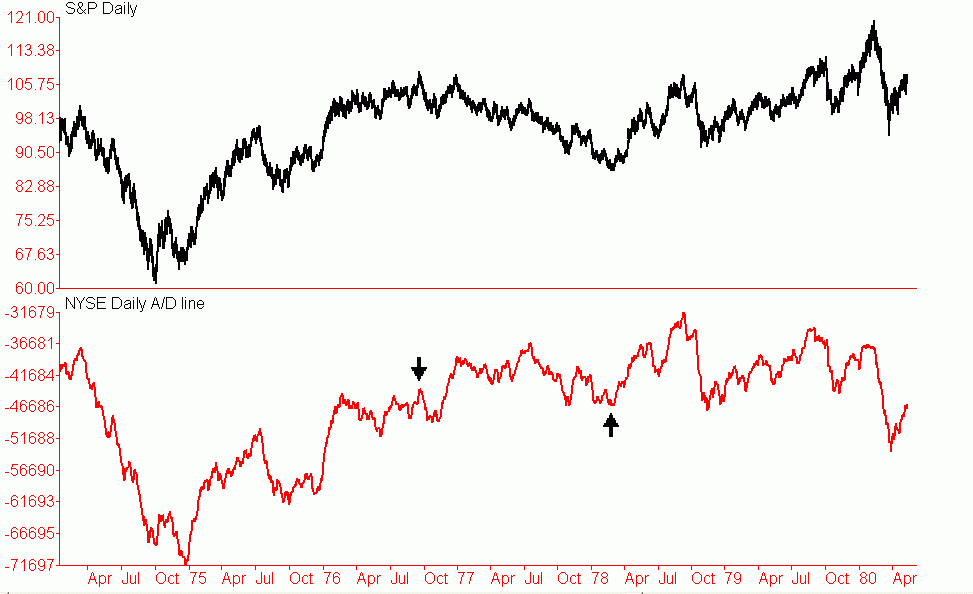
The big debate is whether the thirteen month rally was the beginning of a new secular bull market or nothing more than a very strong bear market rally. As we mentioned two weeks ago, the decline from late April has brought out a lot of commentary about the resumption of the bear market. This has only gotten stronger the past two weeks. This is not how bear markets start. They actually start out 180% opposite with the first wave down accompanied by optimism not pessimism. Although we brought this up last time we find it important to bring it up again. Both the daily and weekly A/D lines confirmed the new highs in late April as did the number of new 52 weeks highs. There has only been one bear market that got underway without a breadth divergence and that was the 1976-1978 bear market. However that bear market was confined to the bull chip stocks that comprise the DJIA and the S&P. The majority of stocks held up quite well during that decline with the A/D line actually higher at the end of that bear market than it was at the beginning of it.
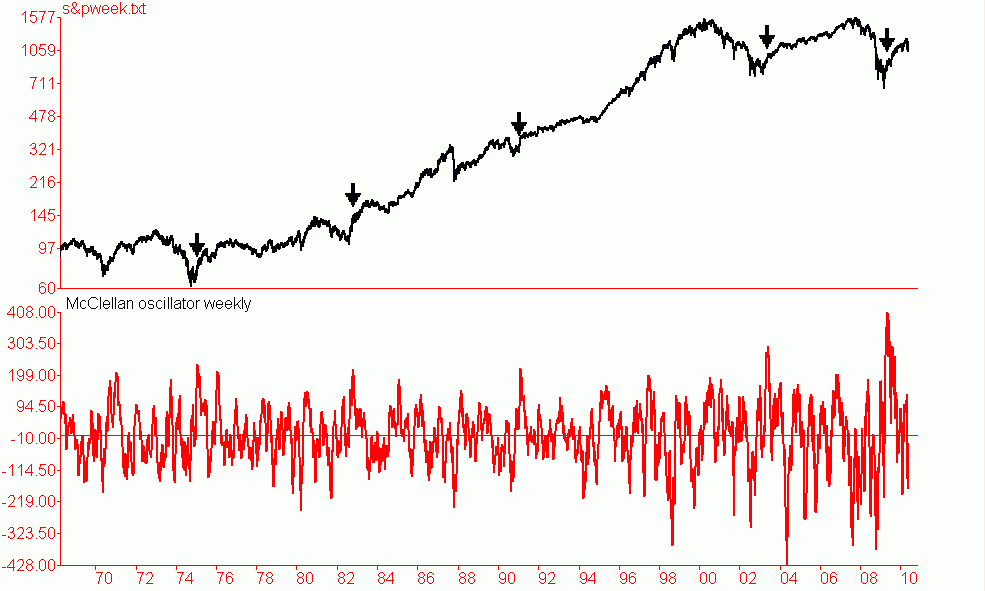
We have not been able to find even one instance where the averages peaked commensurate with a peak in the new highs, not one. The new highs peak several months to several years prior to a peak in the averages. These are but a couple of the may reasons why we are of the opinion that the rally of the last thirteen months is not a bear market rally but the first part of a longer-term secular bear market. There are several other indicators that are consistent with this view. Several months ago we showed the weekly McClellan oscillator. This is calculated based on the weekly A/D numbers not a compressed version of the daily numbers. We pointed out back then that there has been only four previous occasions over the last sixty years of data that we have where the weekly McClellan oscillator reached extreme overbought readings such as we saw in May of last year. We are not basing this in exact levels but on levels relative to the period. Those occurred in February 1975, October 1982, March 1991 and June 2003. Each of those were seen at the beginning of a new multi year bull market. The S&P continued to move higher for eight to twelve months before the first multi month correction of any significance unfolded. And in the case of the 1991 occurrence we did not get the first multi month correction for a nearly three years. A number of other medium and long-term indicators reached similar levels over the last several months. This includes our weekly breadth oscillator and the fifty two week rate of change to name a few. The other thing that these five occurrences have in common is that the extreme overbought thrust occurred very soon after a price low that followed a very deep and in most case prolonged correction or sideways range (1982).
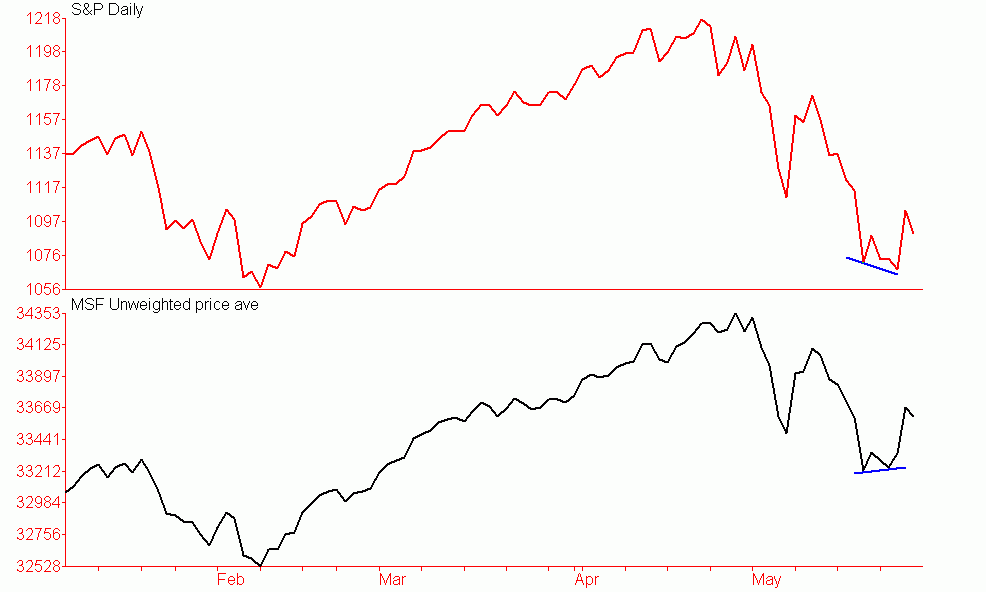
Short-term we had a number of divergences in place art last weeks low. Some of the indicators were also diverging with their May 6-7 lows and others with their May 20 low. The former include a number of volume indicators and the latter a number of breadth related indicators including the McClellan oscillator. There are also divergences in place on other indicators such as 13-day RSI. These divergences are not yet fully confirmed but a continuation of the rally this week would lock them in at least on a short-term basis. We also have a very subtle divergence between the S&P and our NYSE un-weighted price average as the latter held slightly above its May 20 low last week while the S&P made a slightly lower low on May 27. Also note how far above the February low our un-weighted price average is compared to the S&P. What this tells us is that the average stock on the NYSE is holding up far better than the S&P and DJIA indicating that a good portion of the selling has been focused on the big cap stocks and not as much on the broad list.
The decline from late April has been a little stronger and deeper than we had expected. But as deep and strong as it has been it is more consistent with the first real correction in a new bull market not the start of a new bear market or for that matter a continuation of the old bear market.
Go to www.marketsummaryandforecast.com to sign up for a free trial to all of our services. Please note that I will be out of town from June 3 to June 10. We will mark the start of any trail after that date


